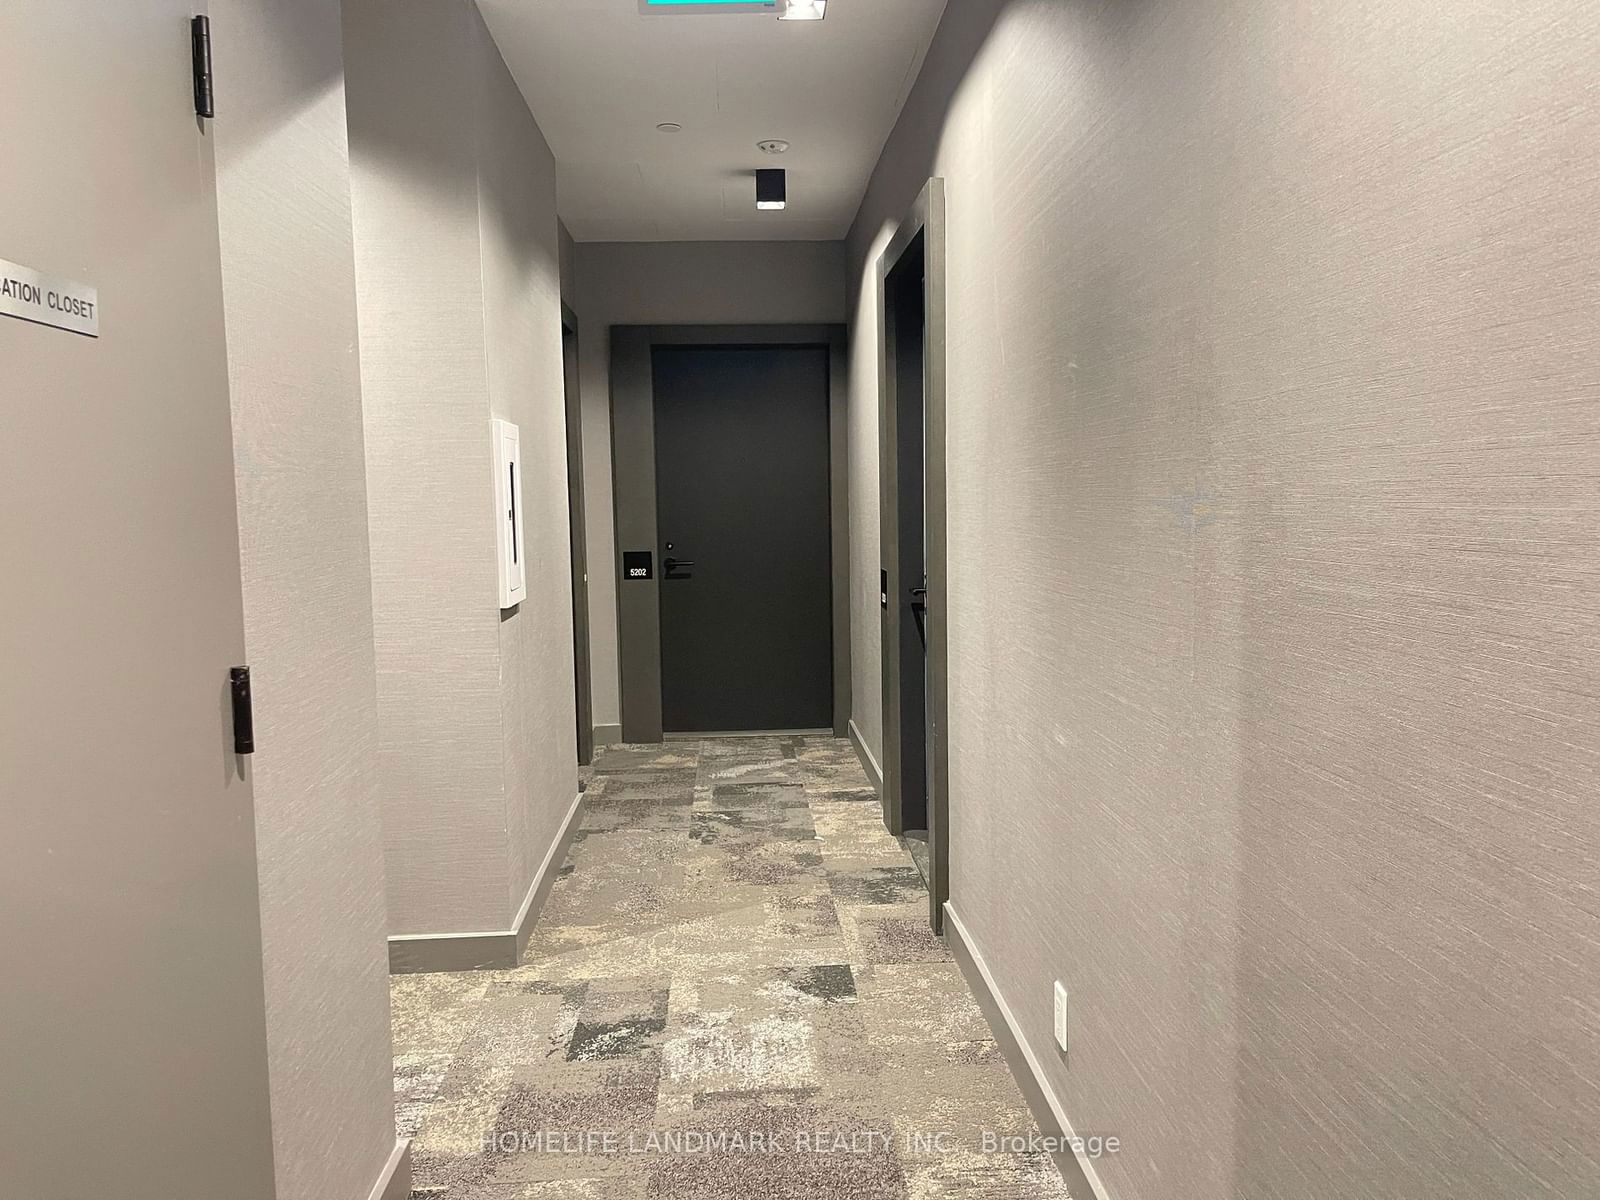
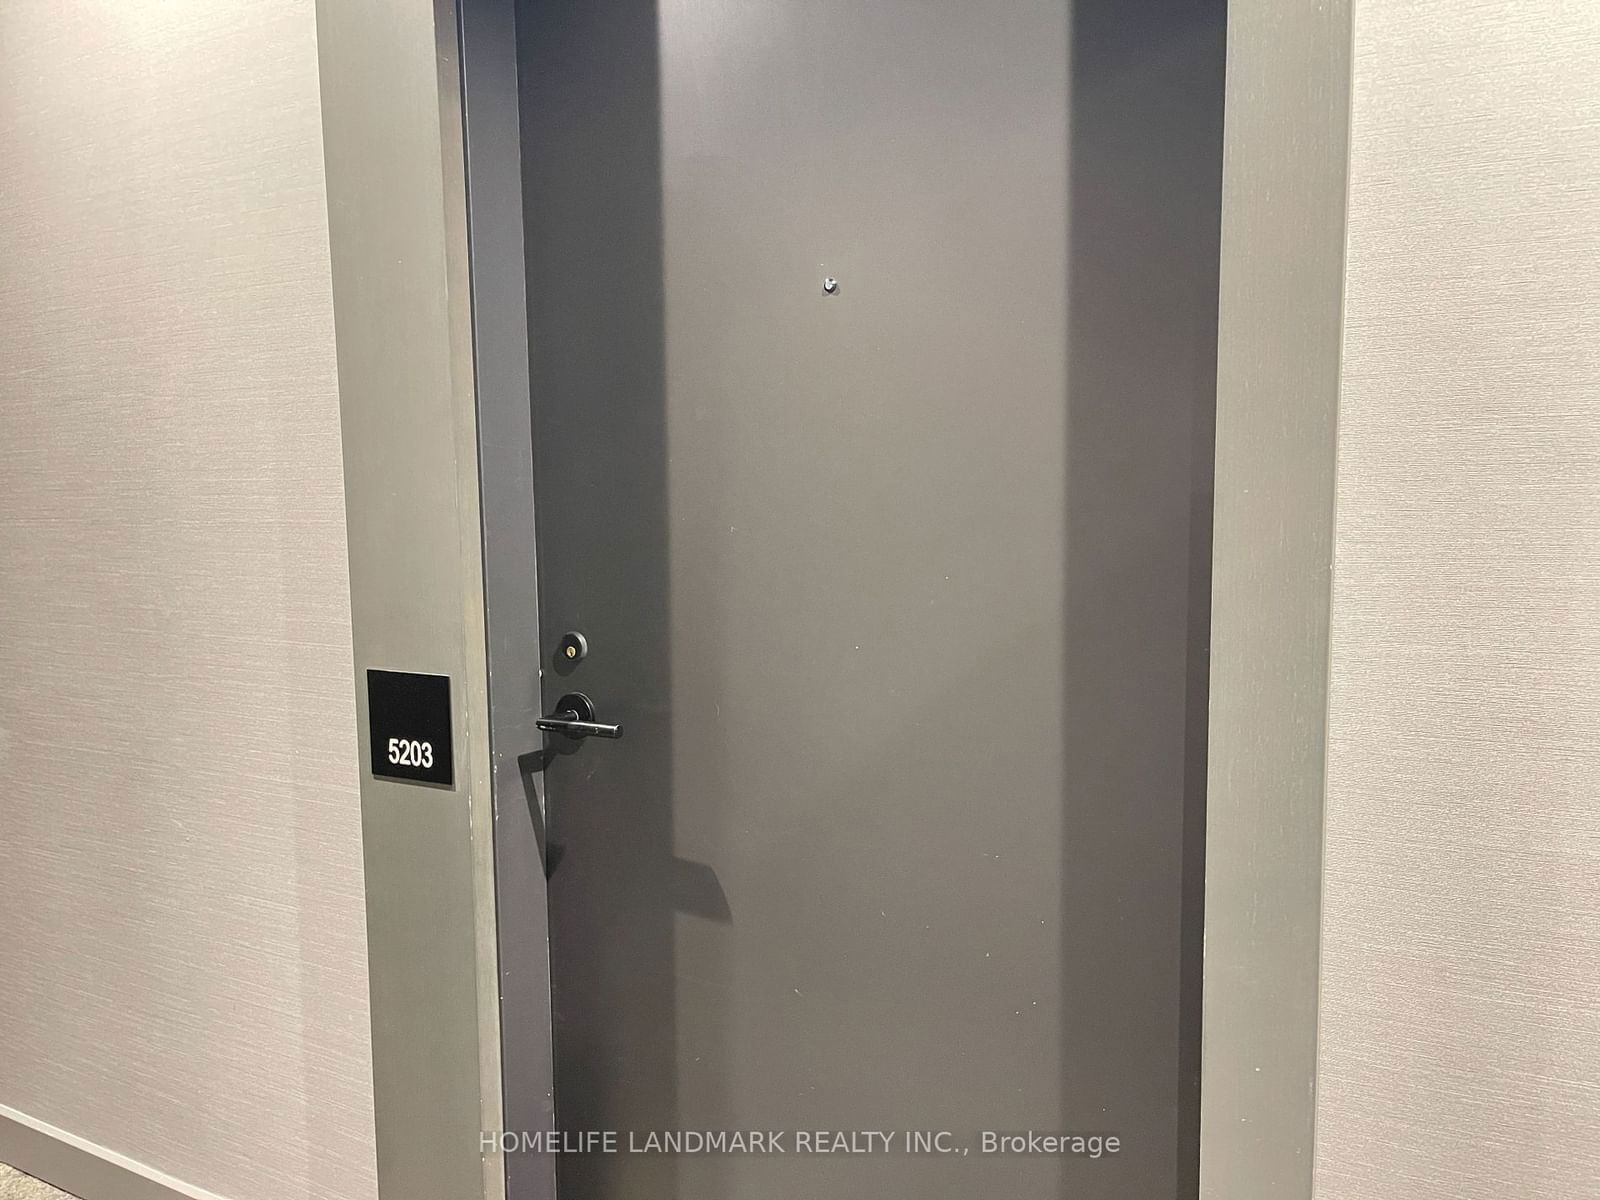
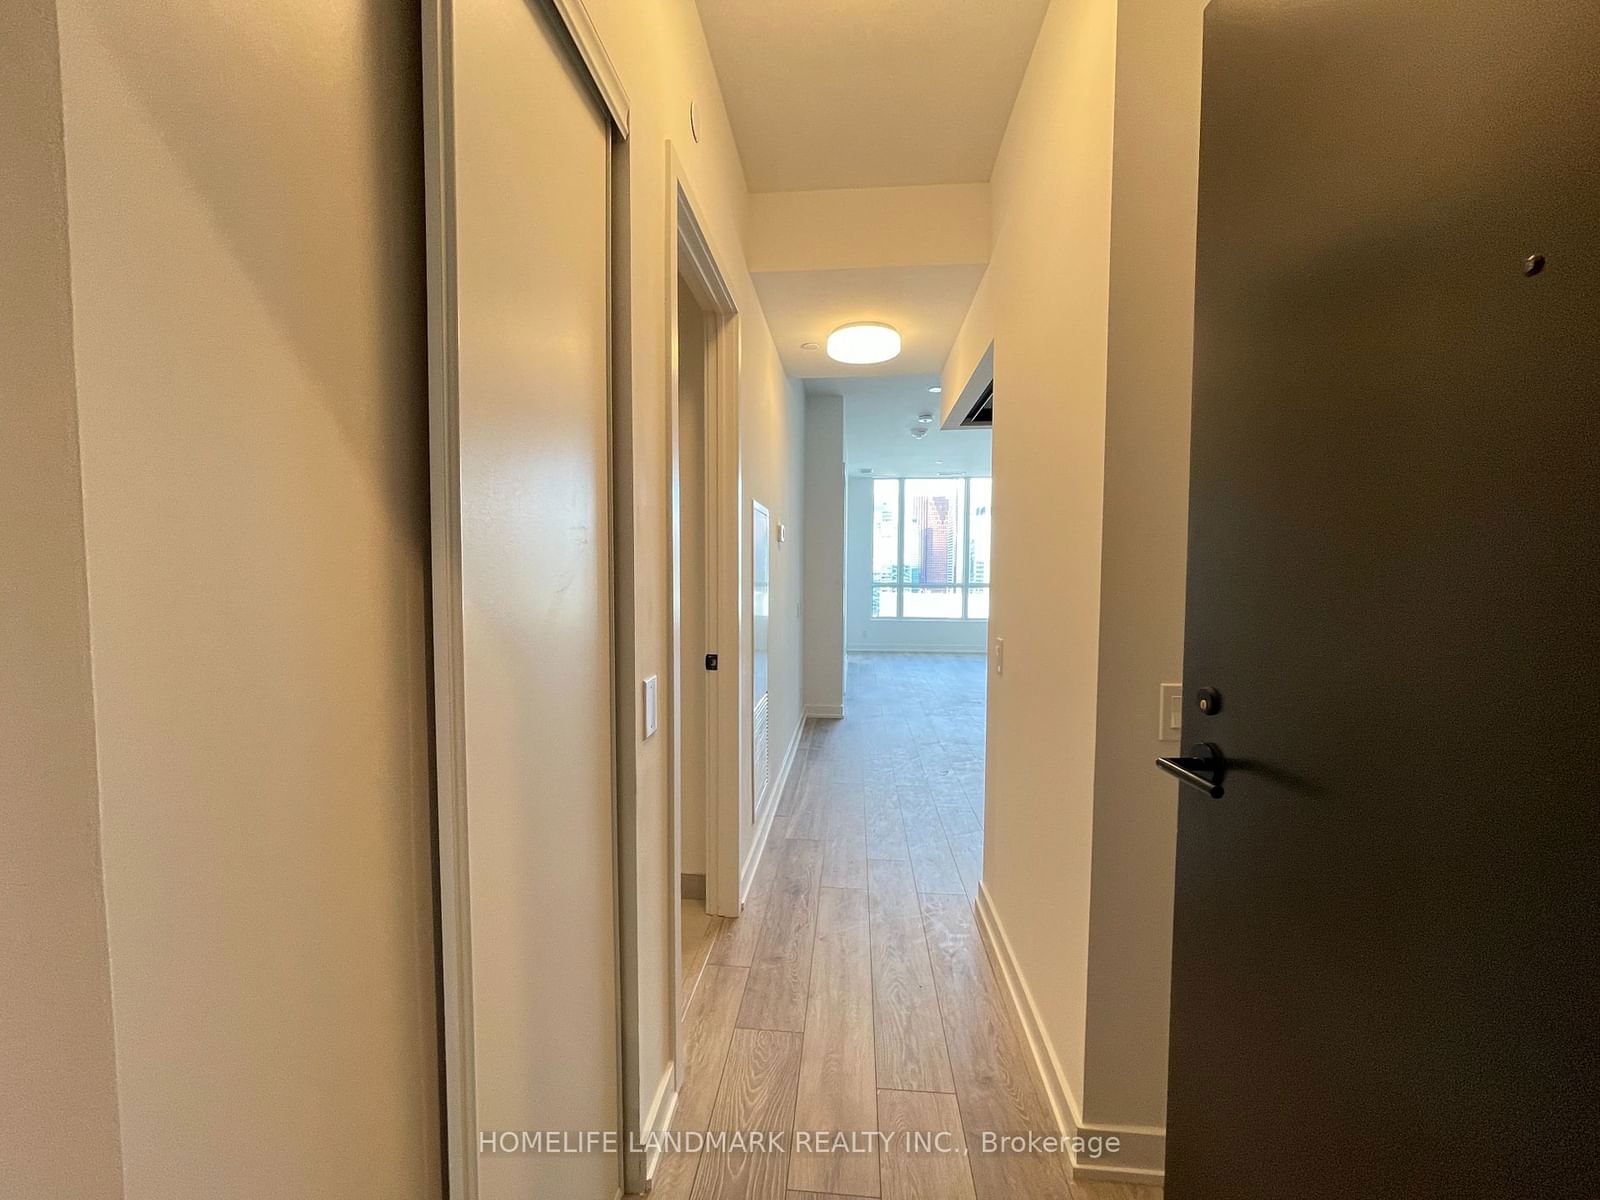
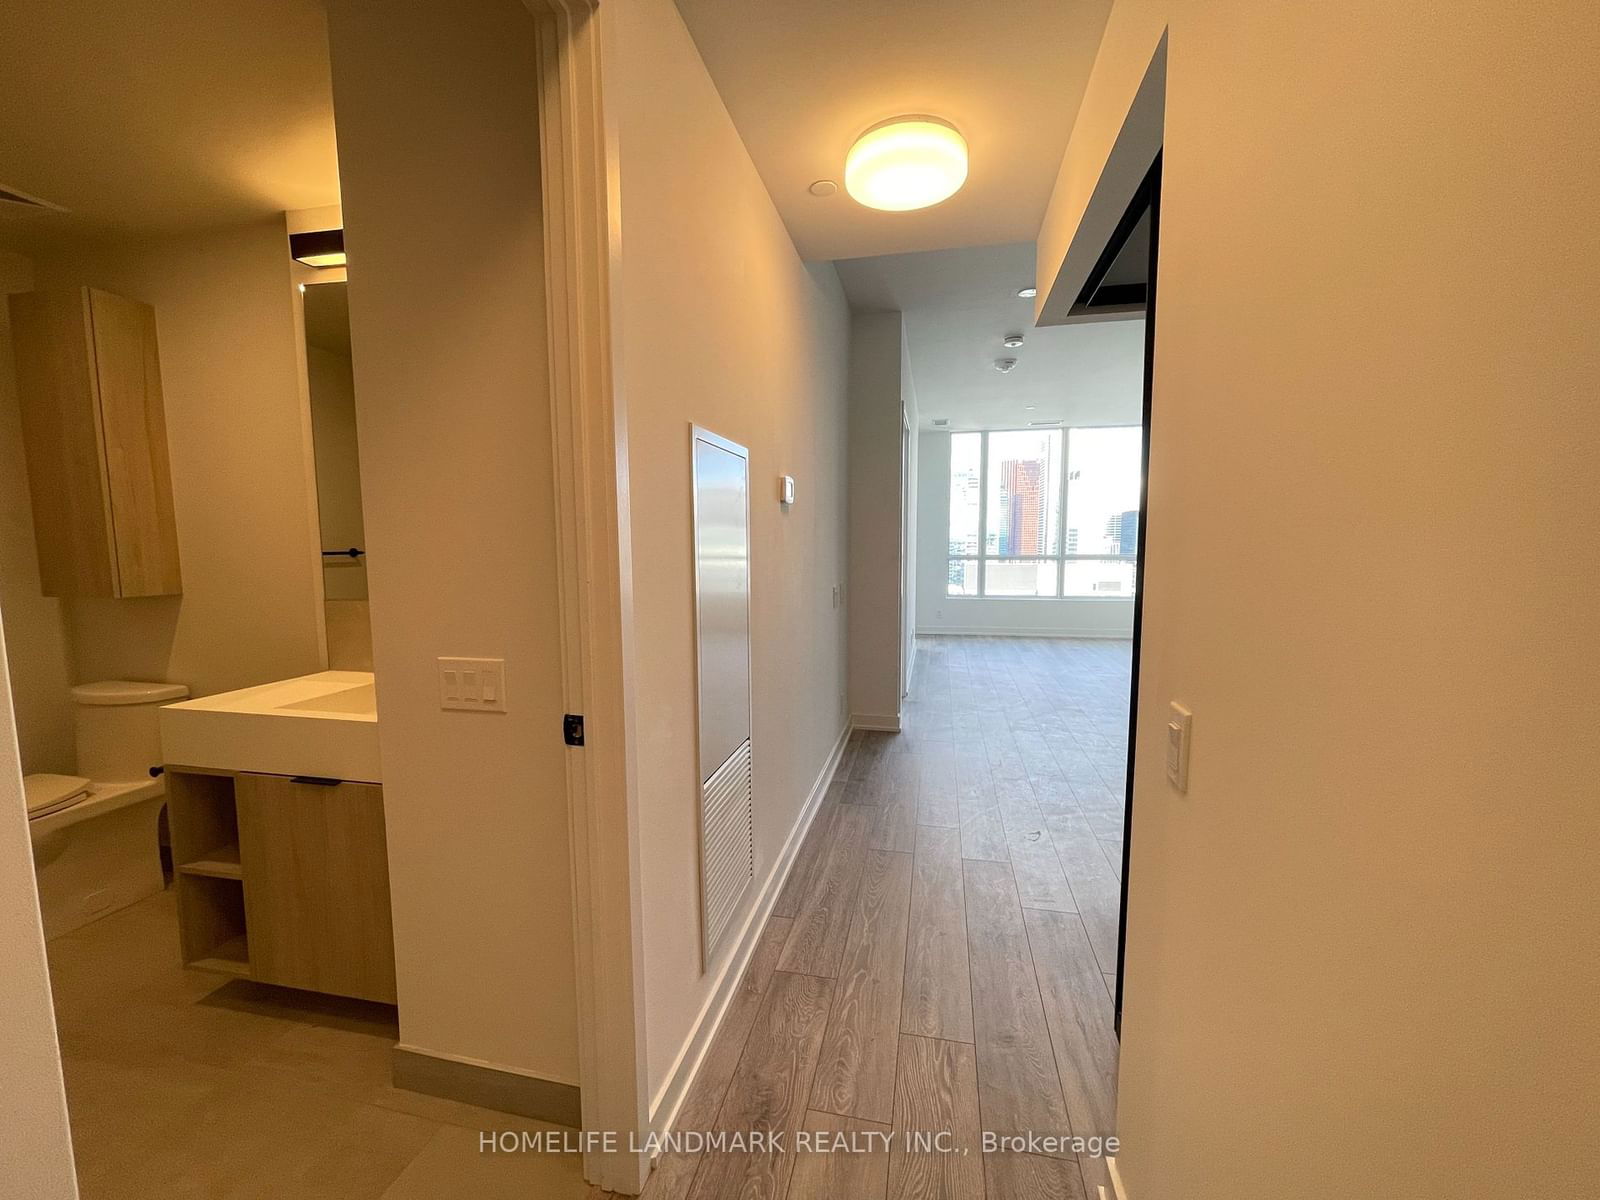
5203 - 108 Peter St
Listing History
Unit Highlights
Utilities Included
Utility Type
- Air Conditioning
- Central Air
- Heat Source
- Gas
- Heating
- Forced Air
Room Dimensions
Room dimensions are not available for this listing.
About this Listing
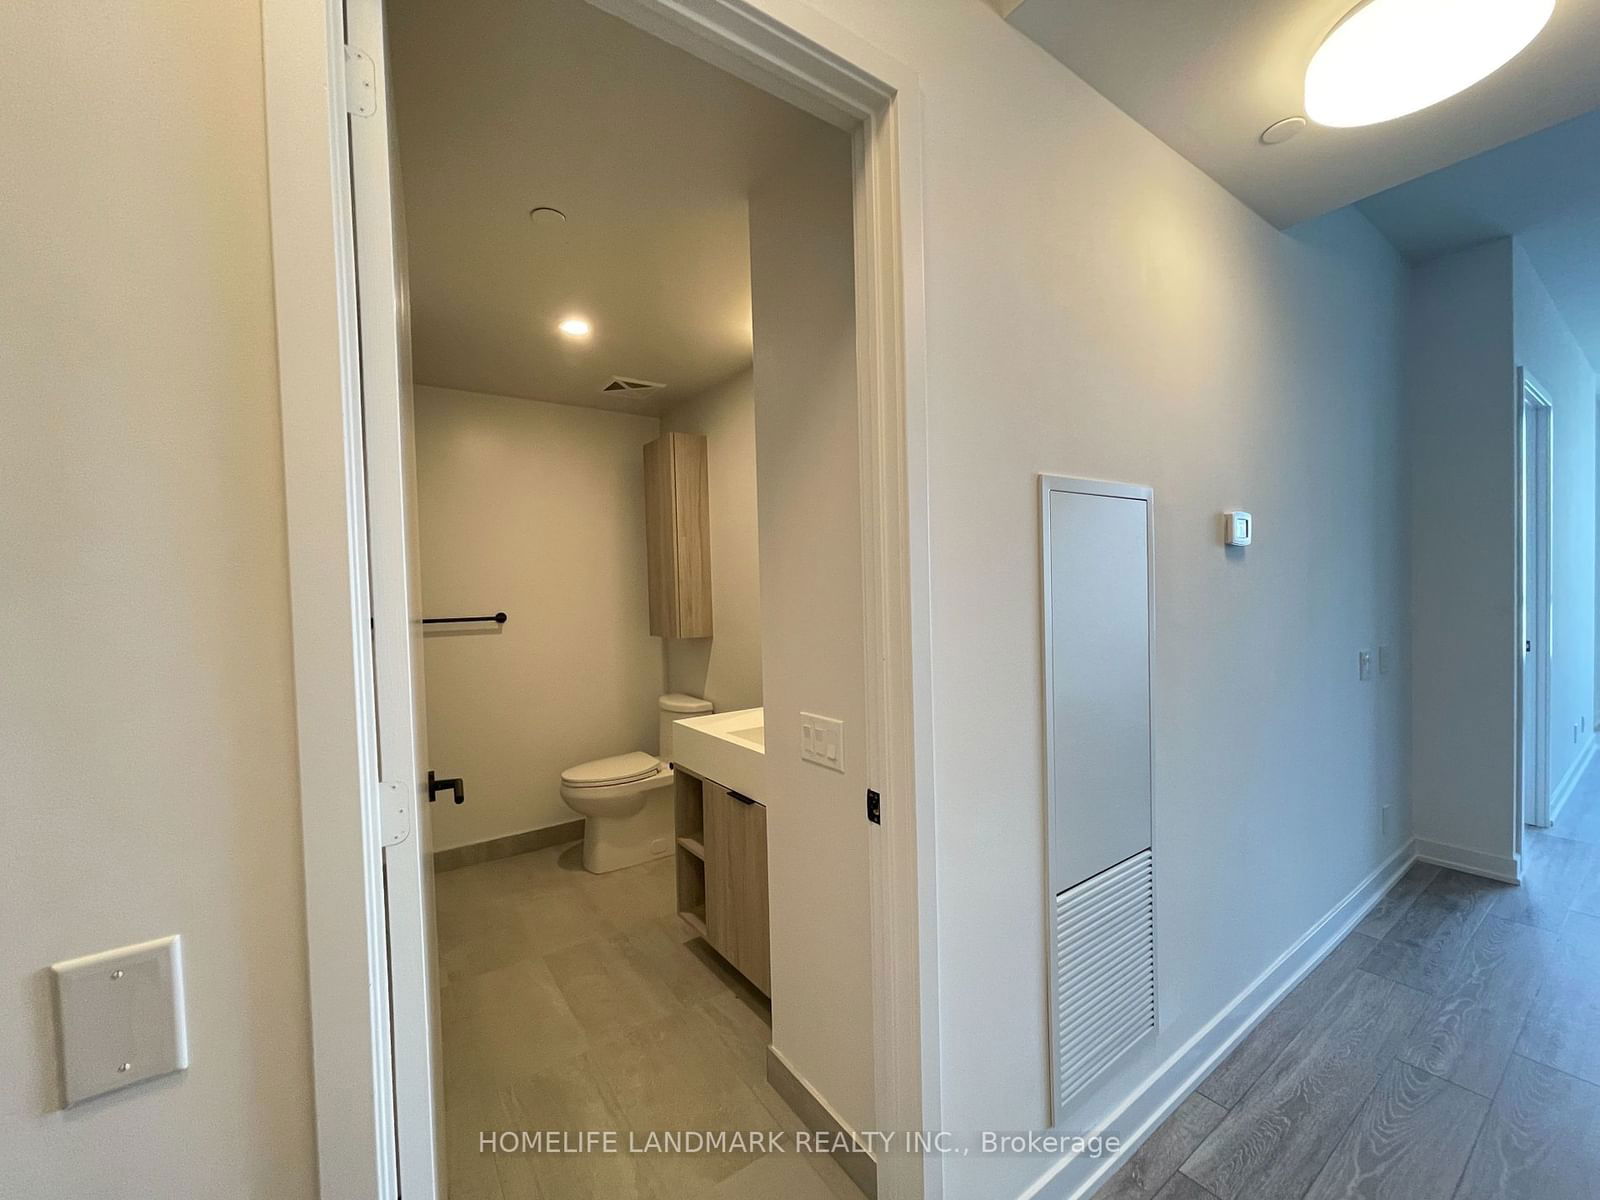
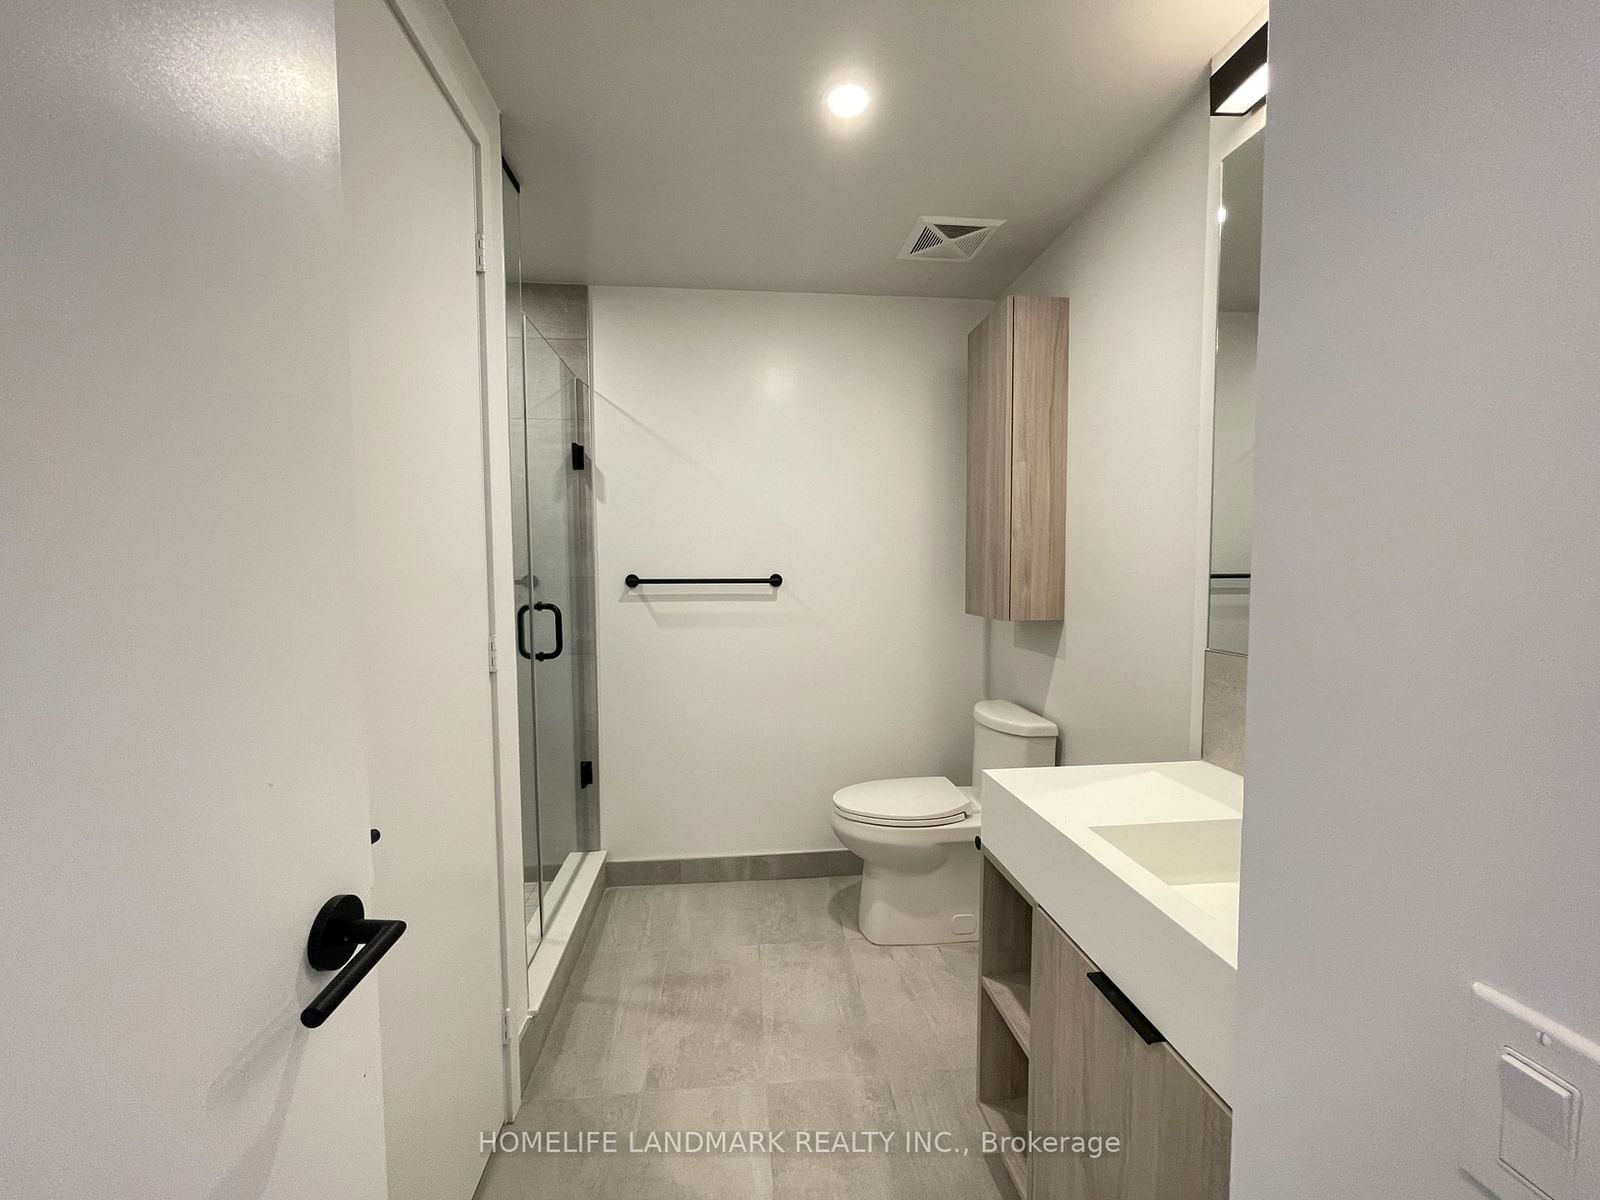
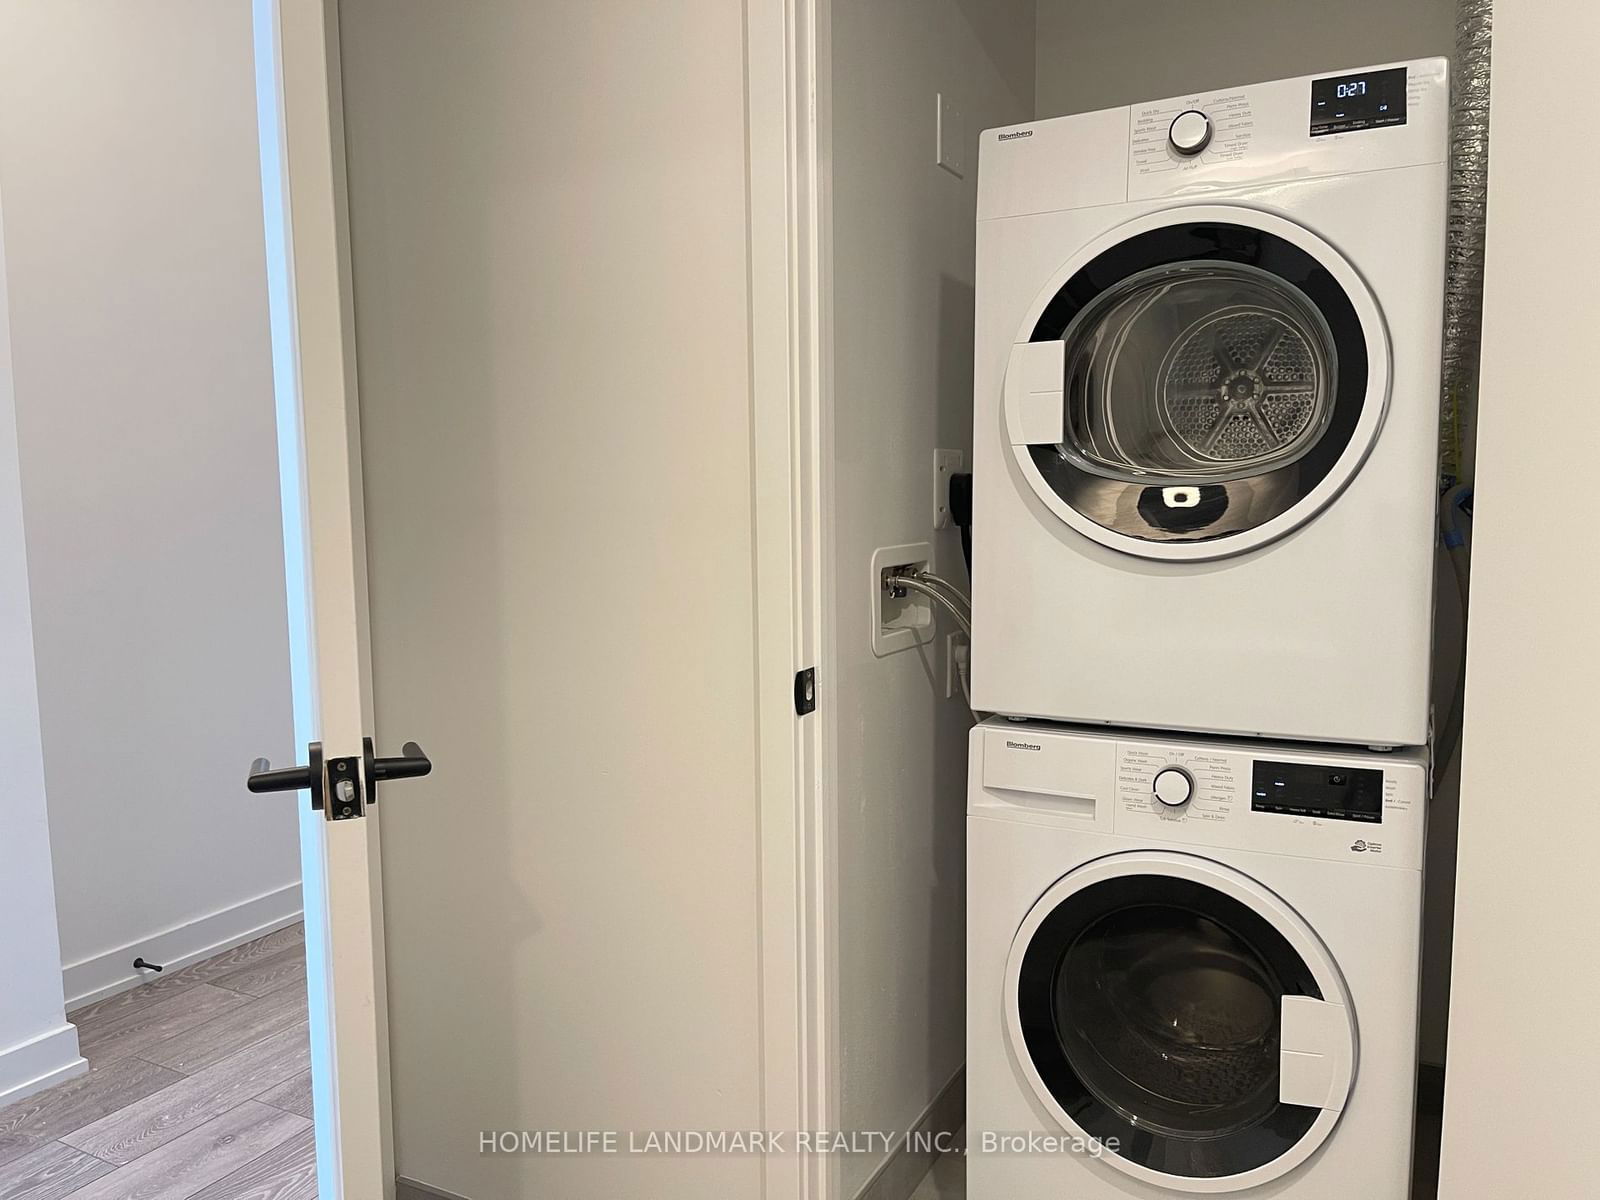
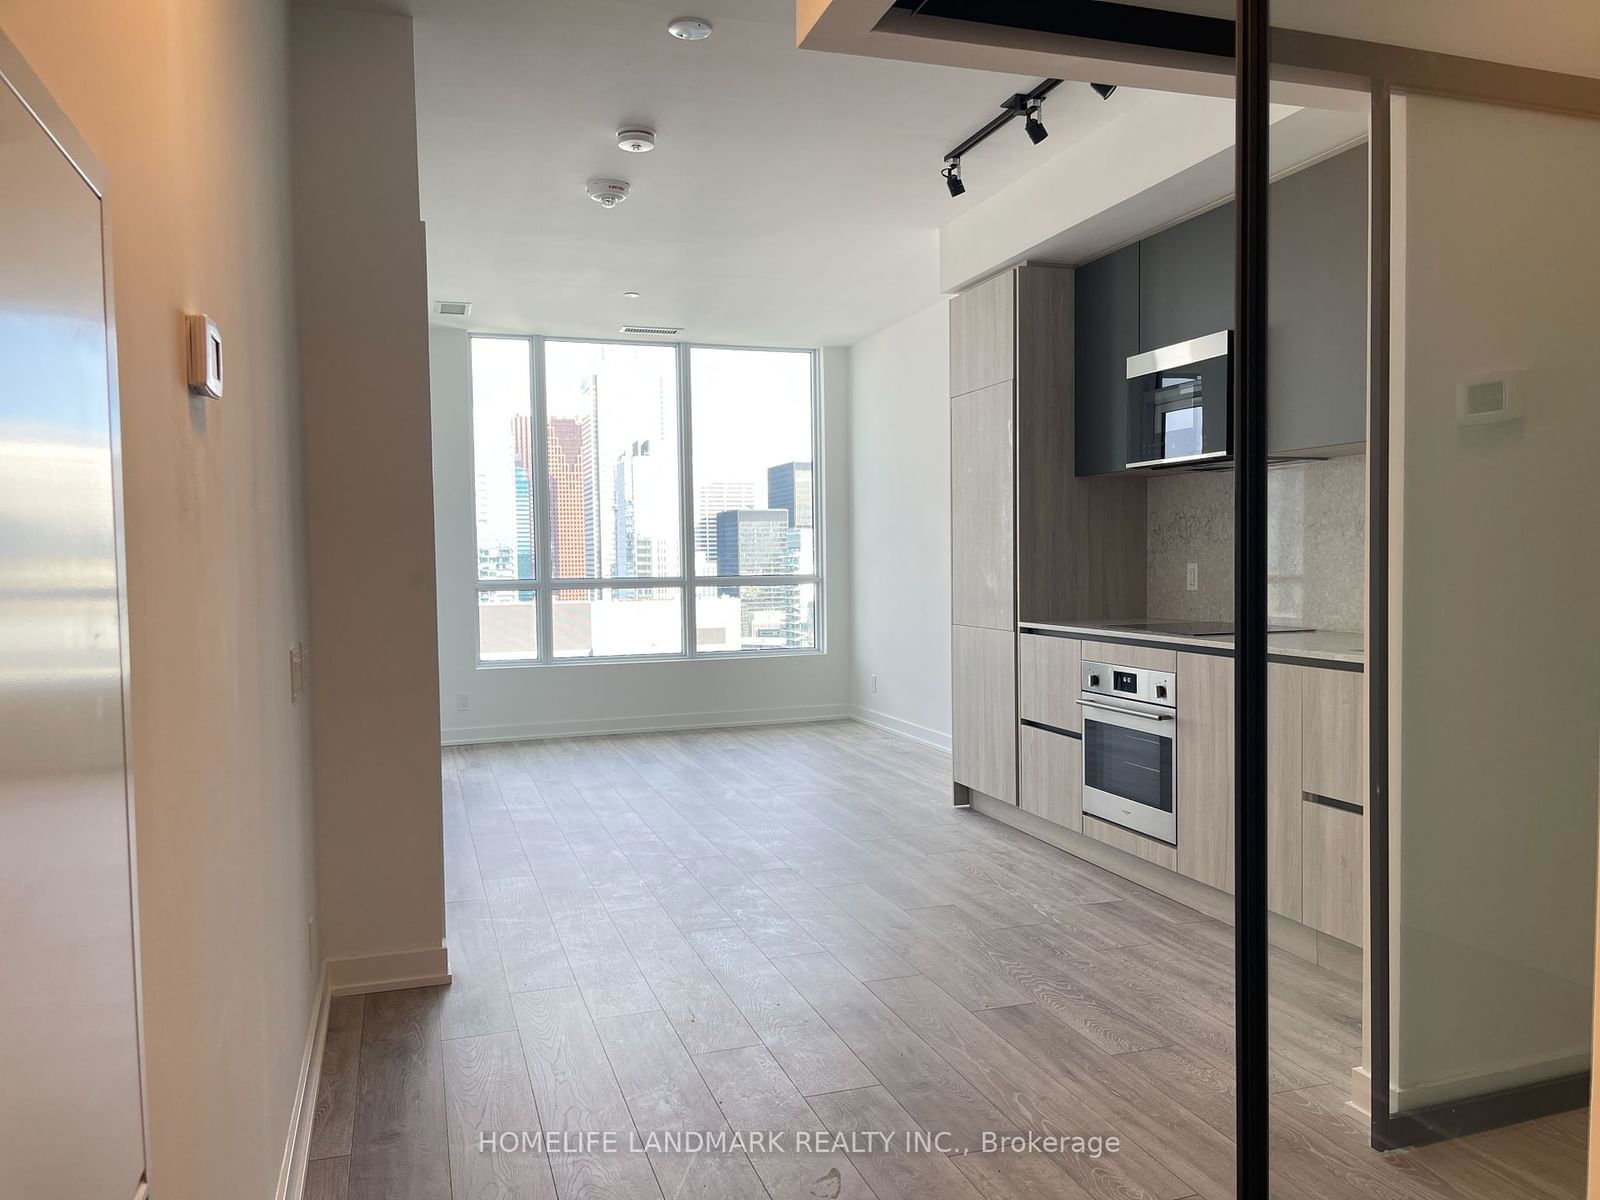
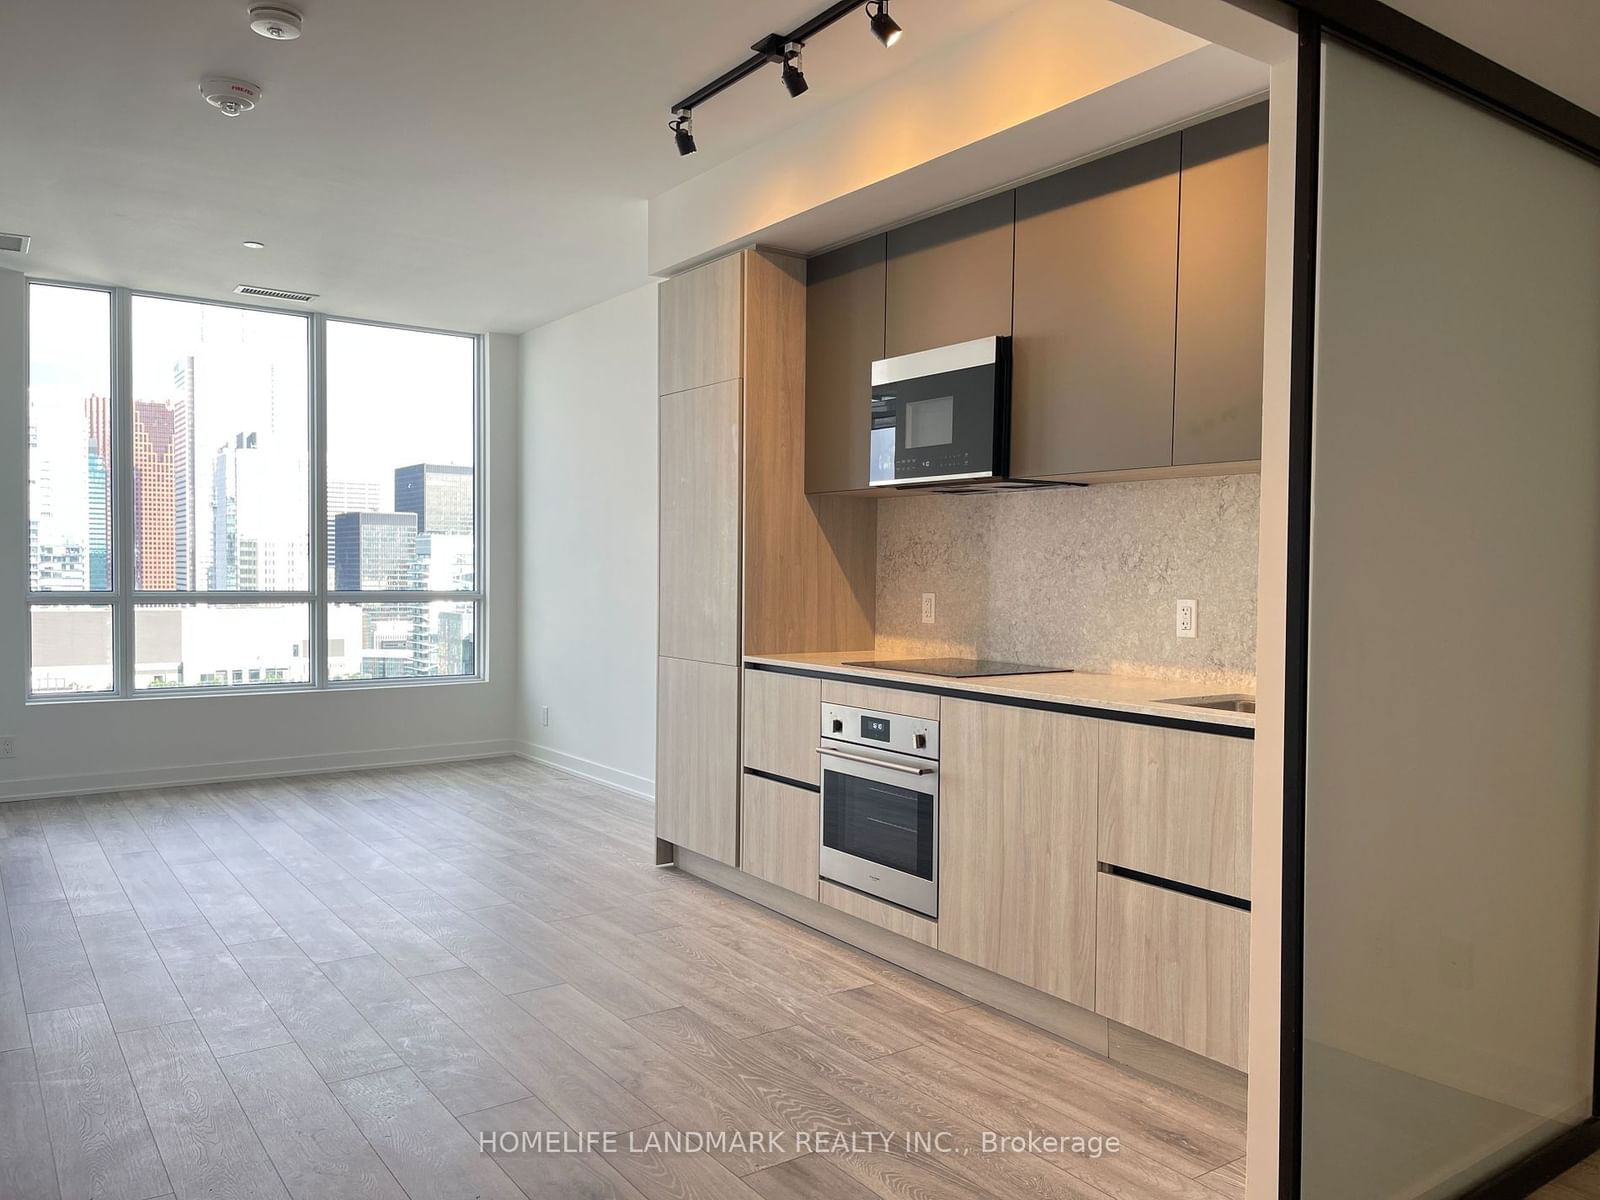
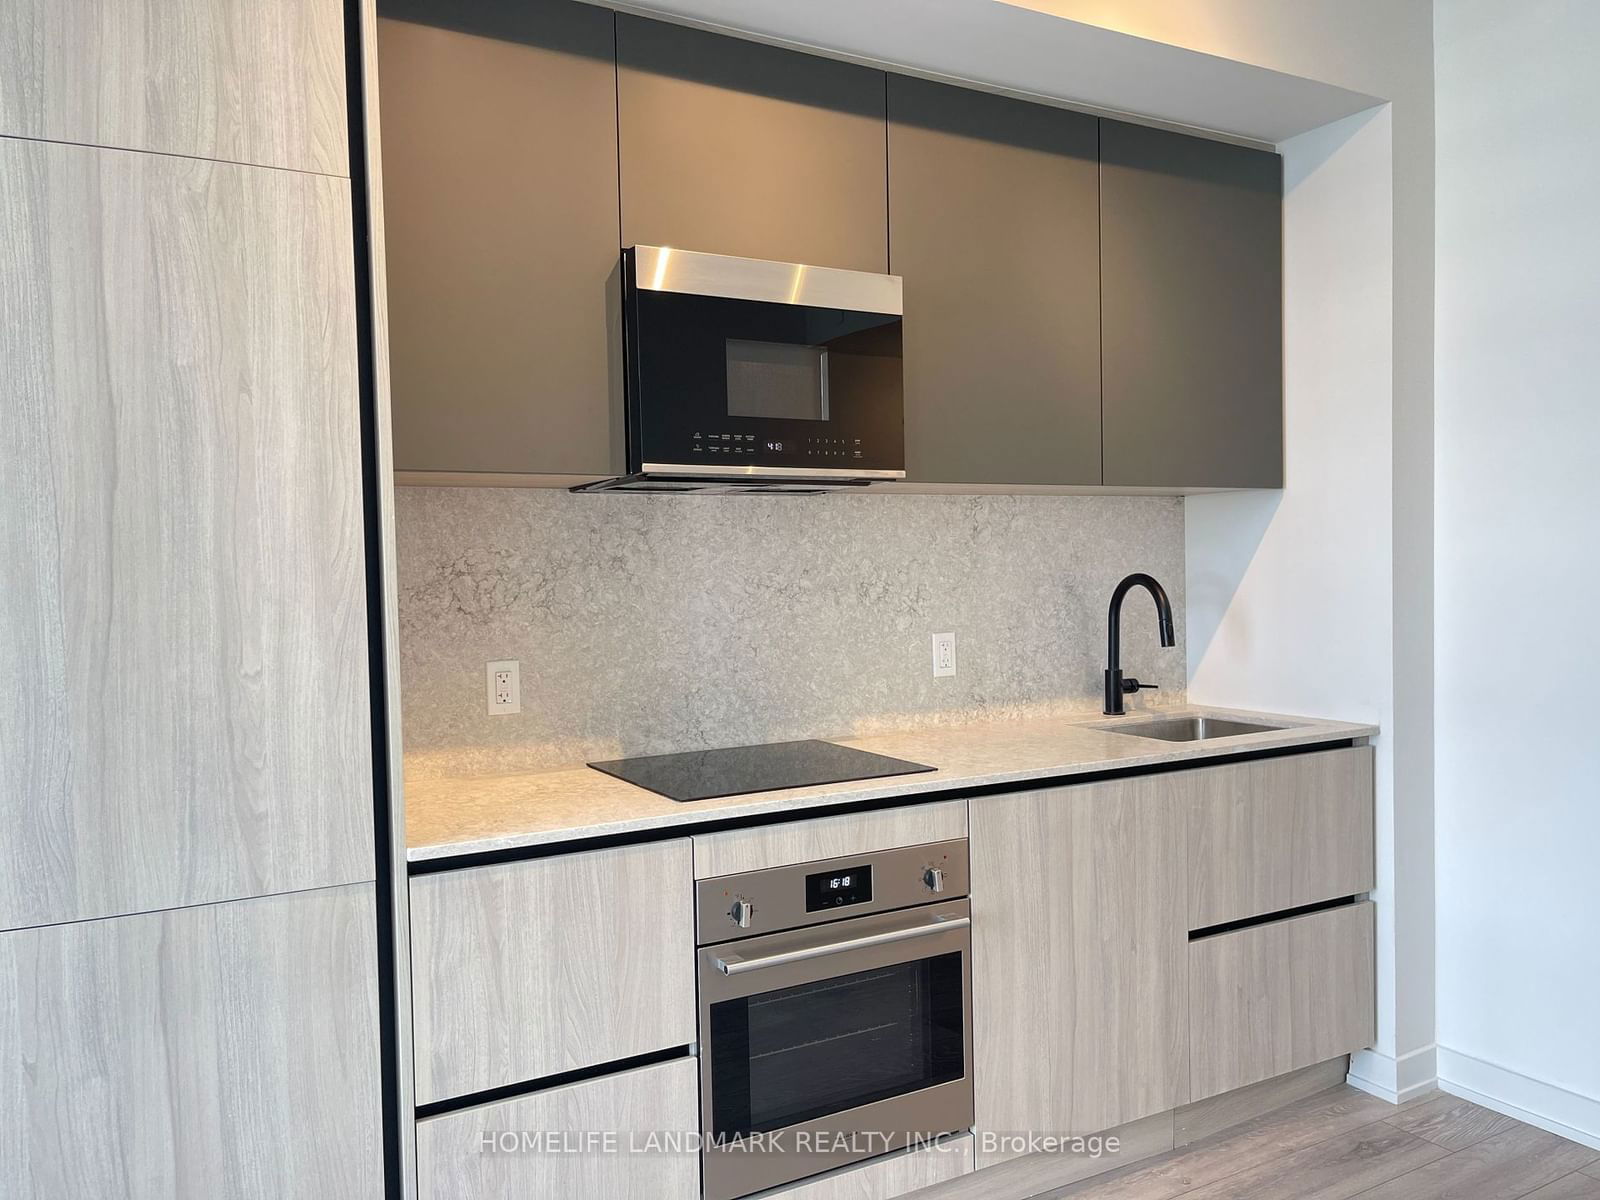
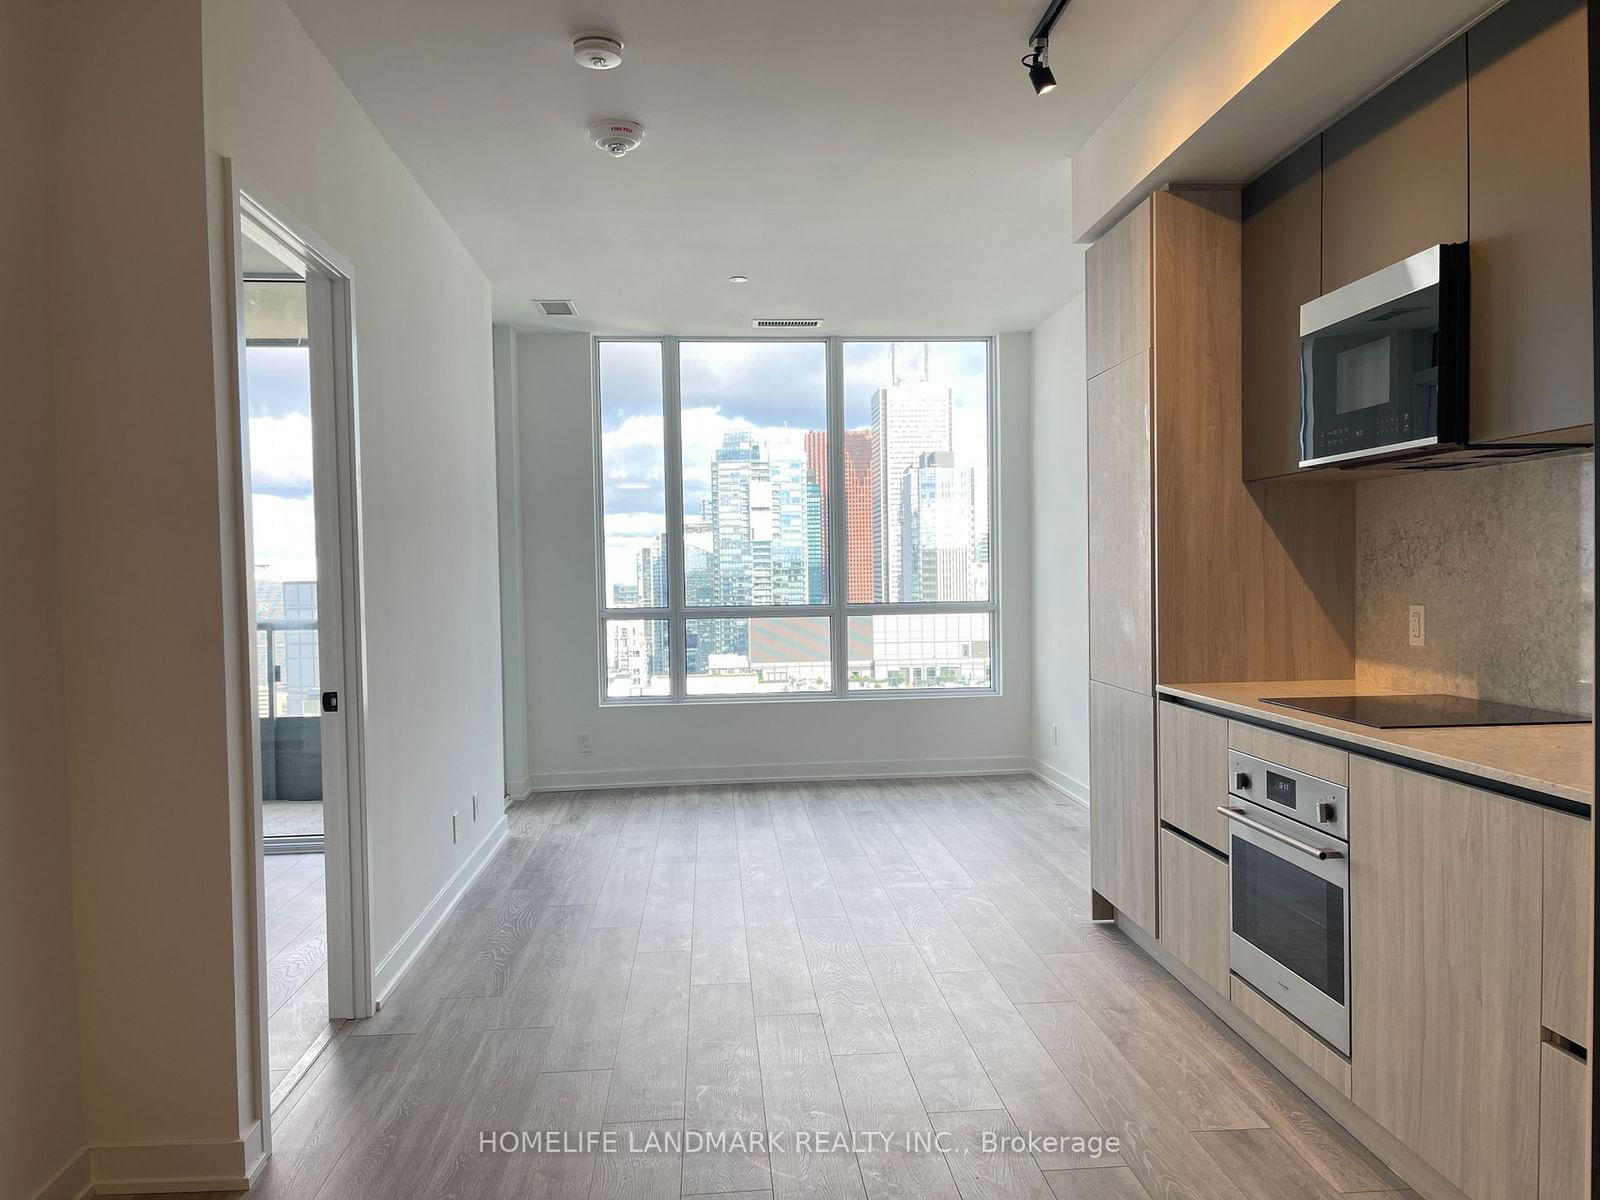
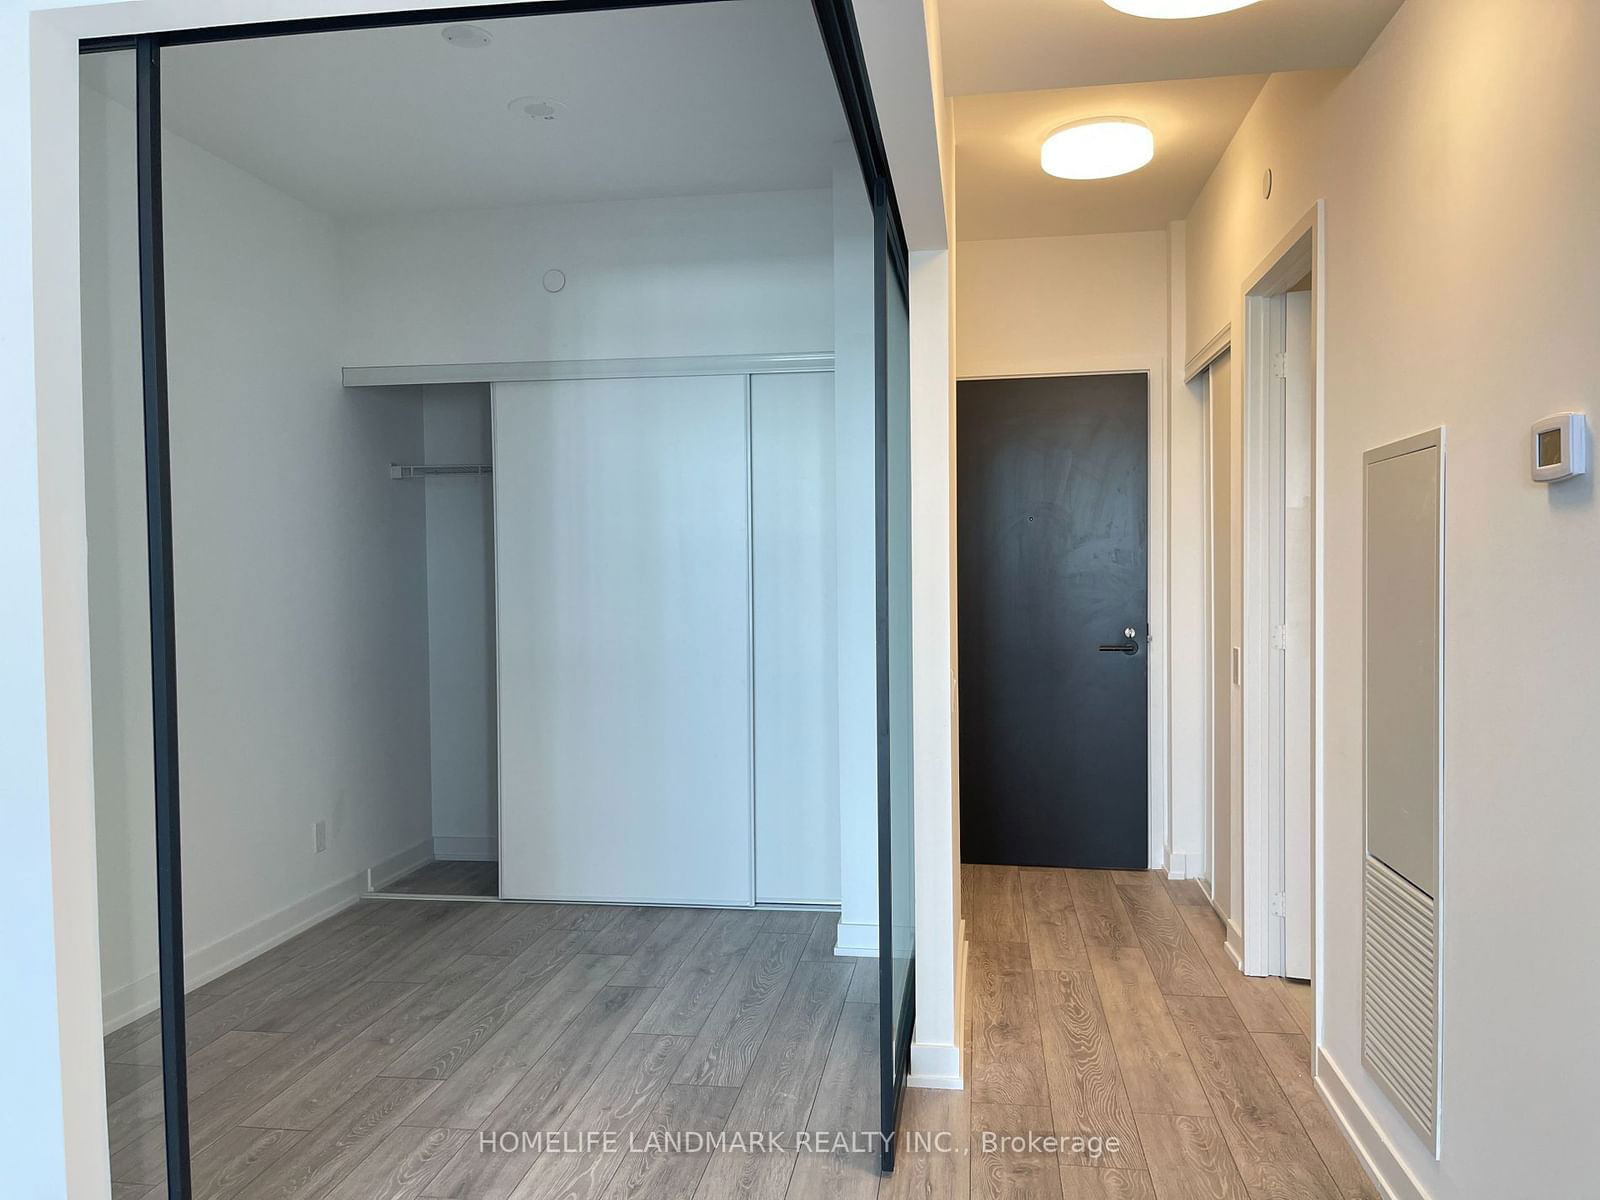
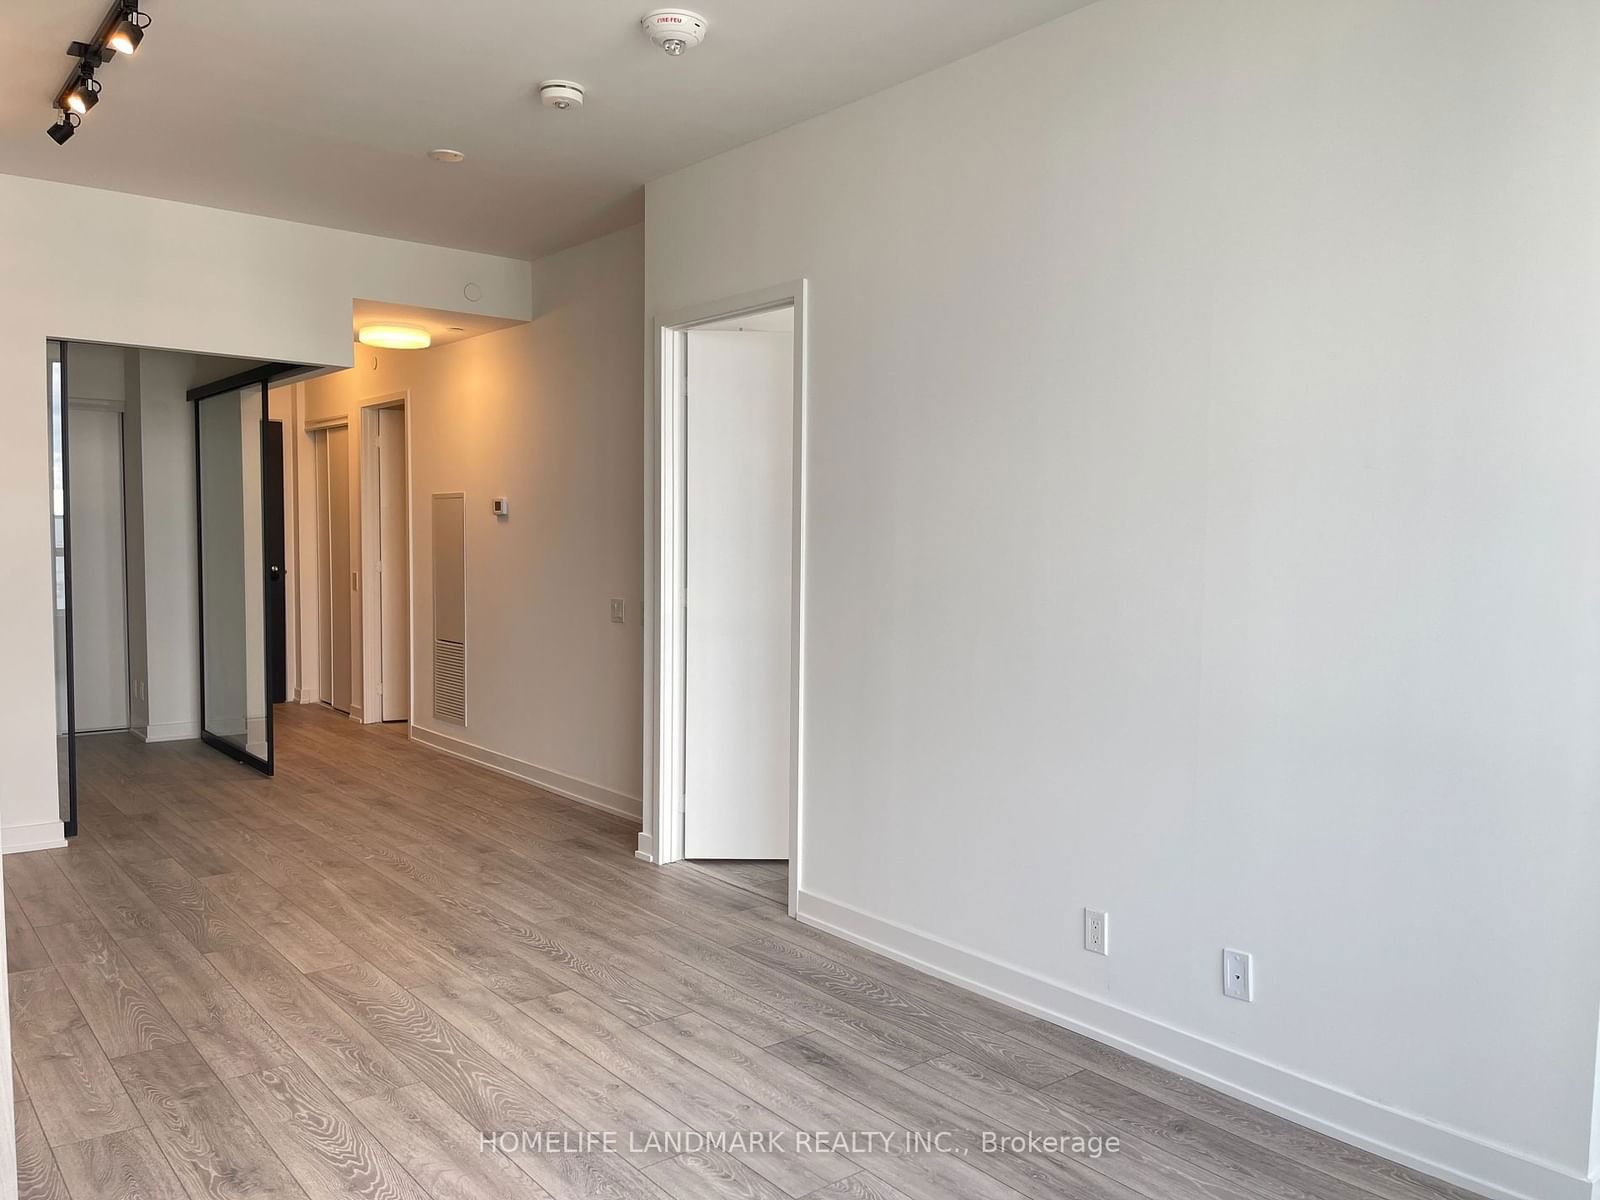
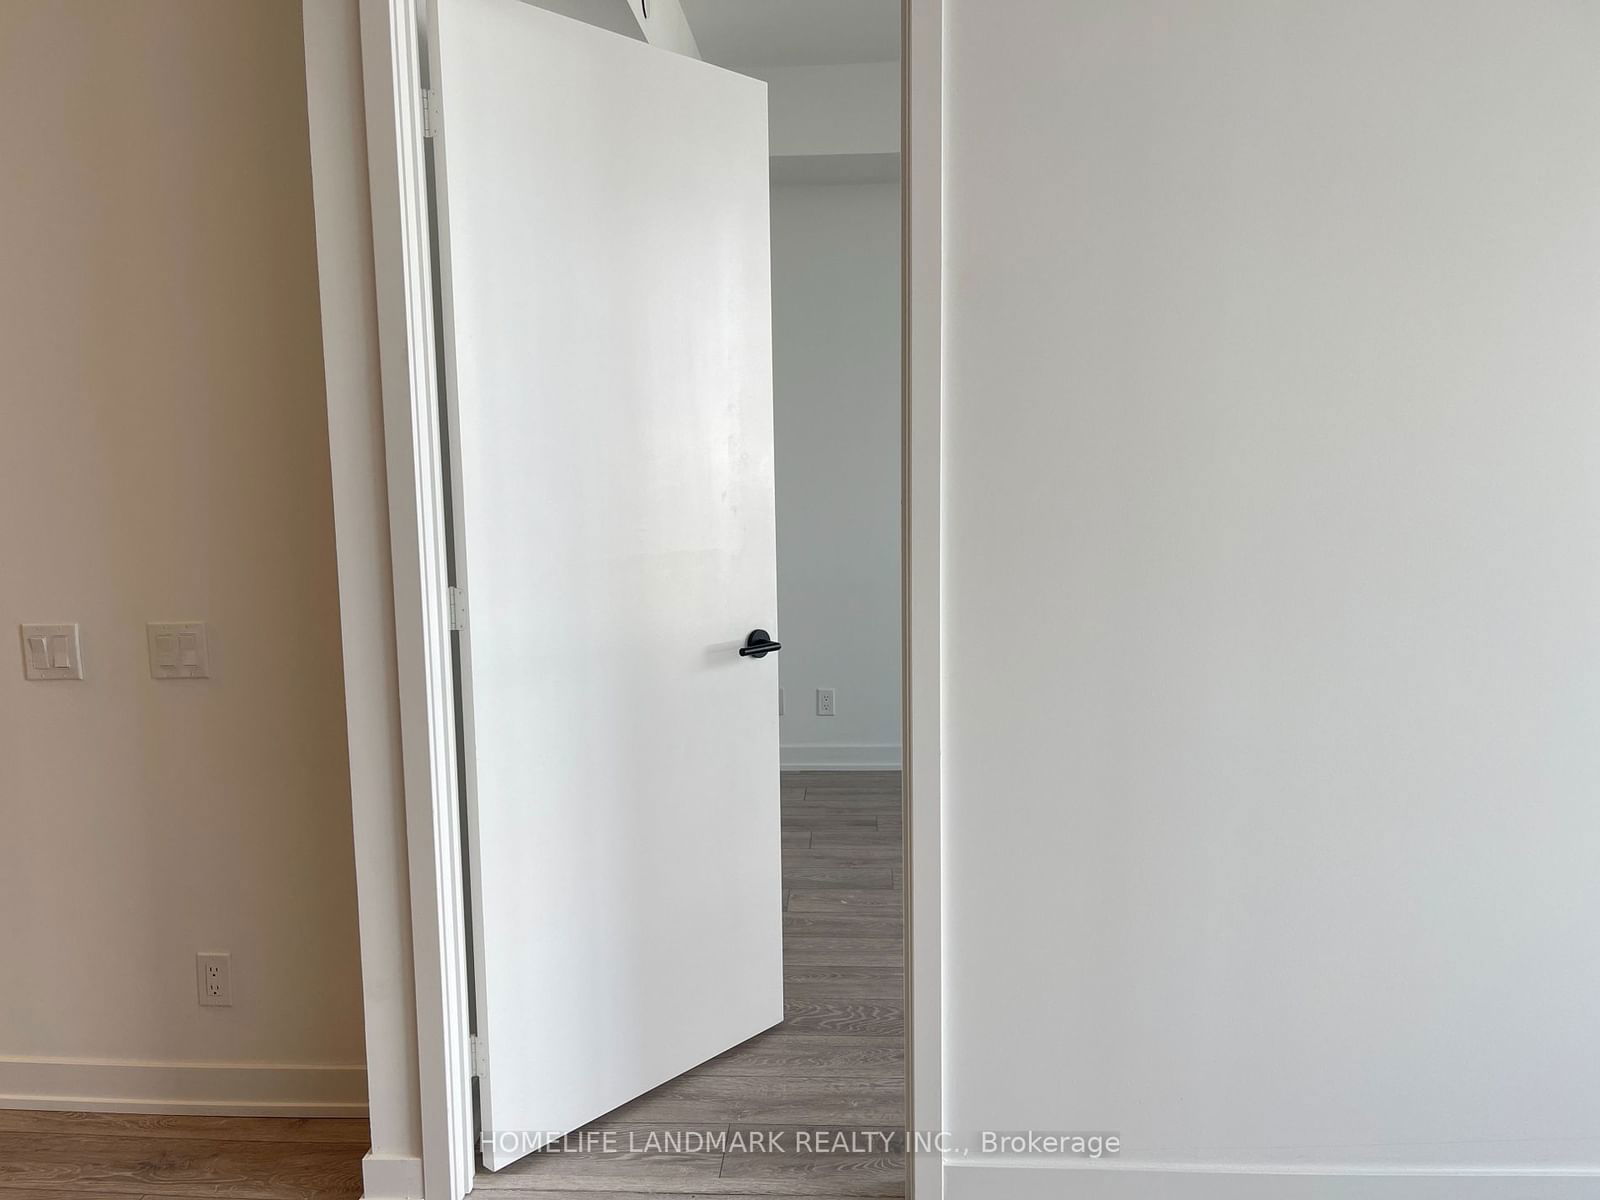
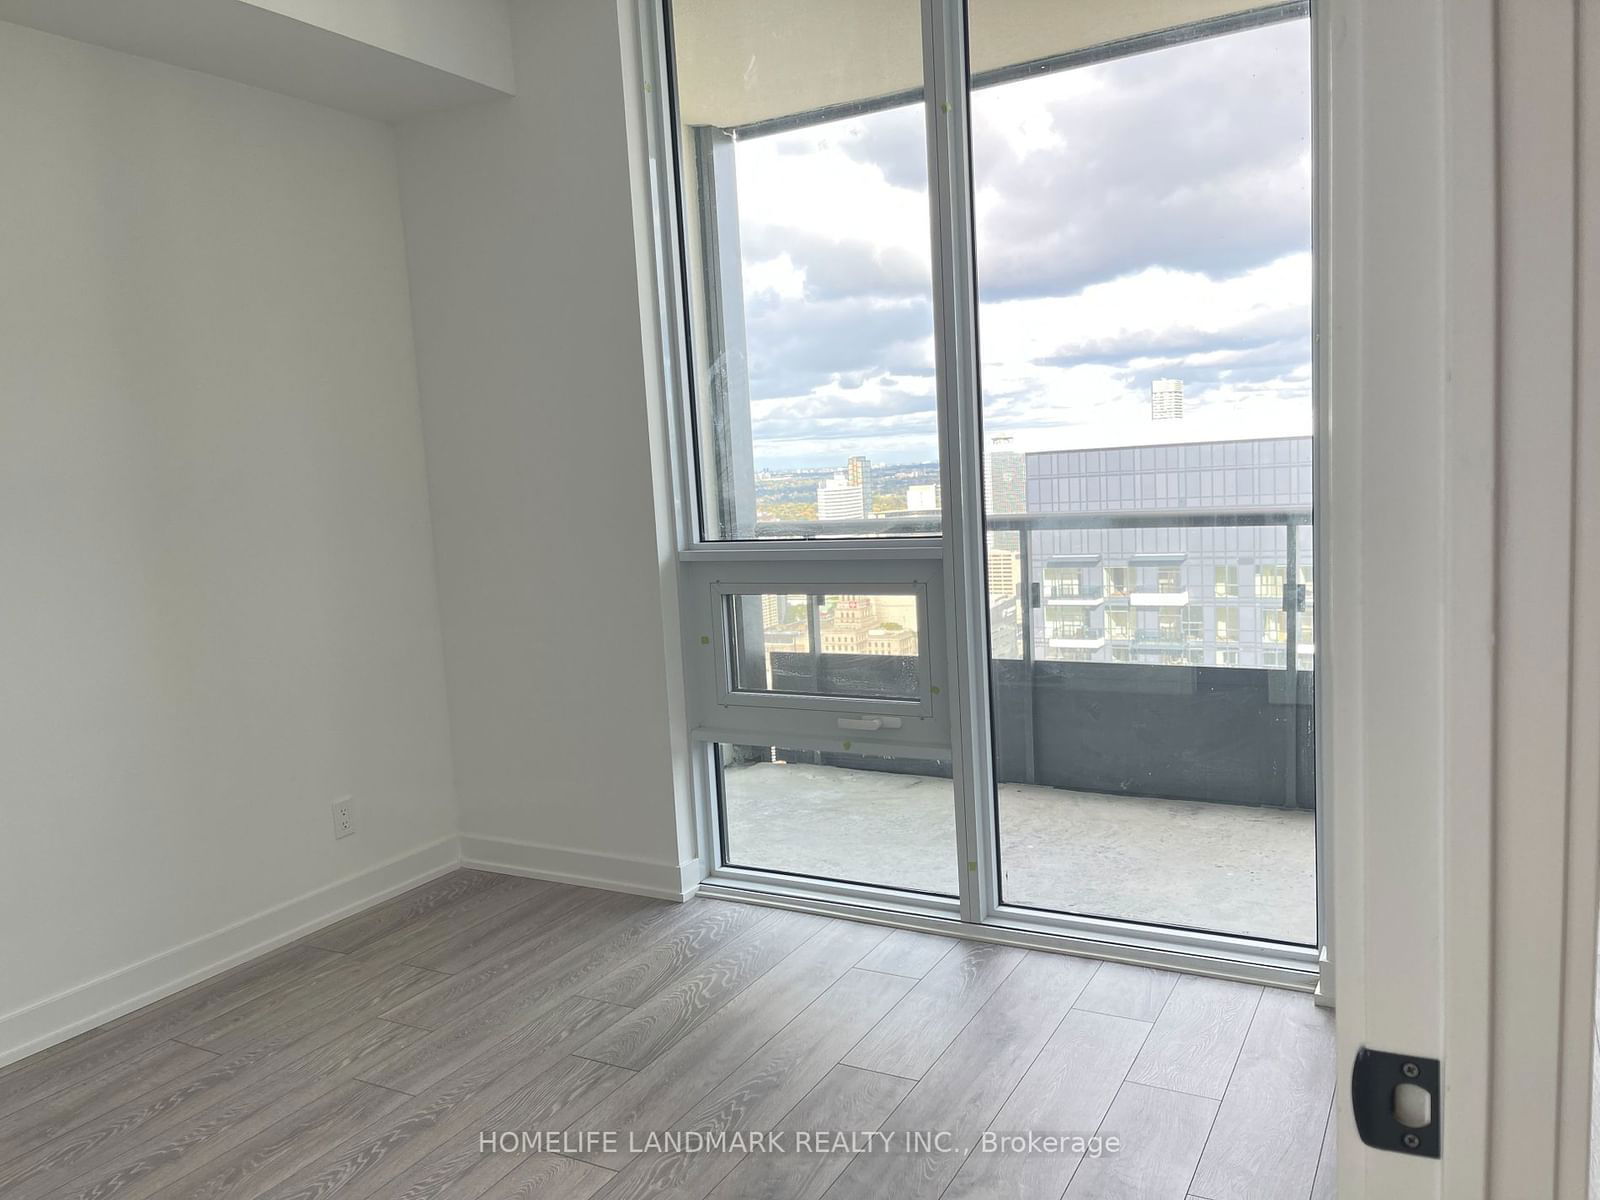
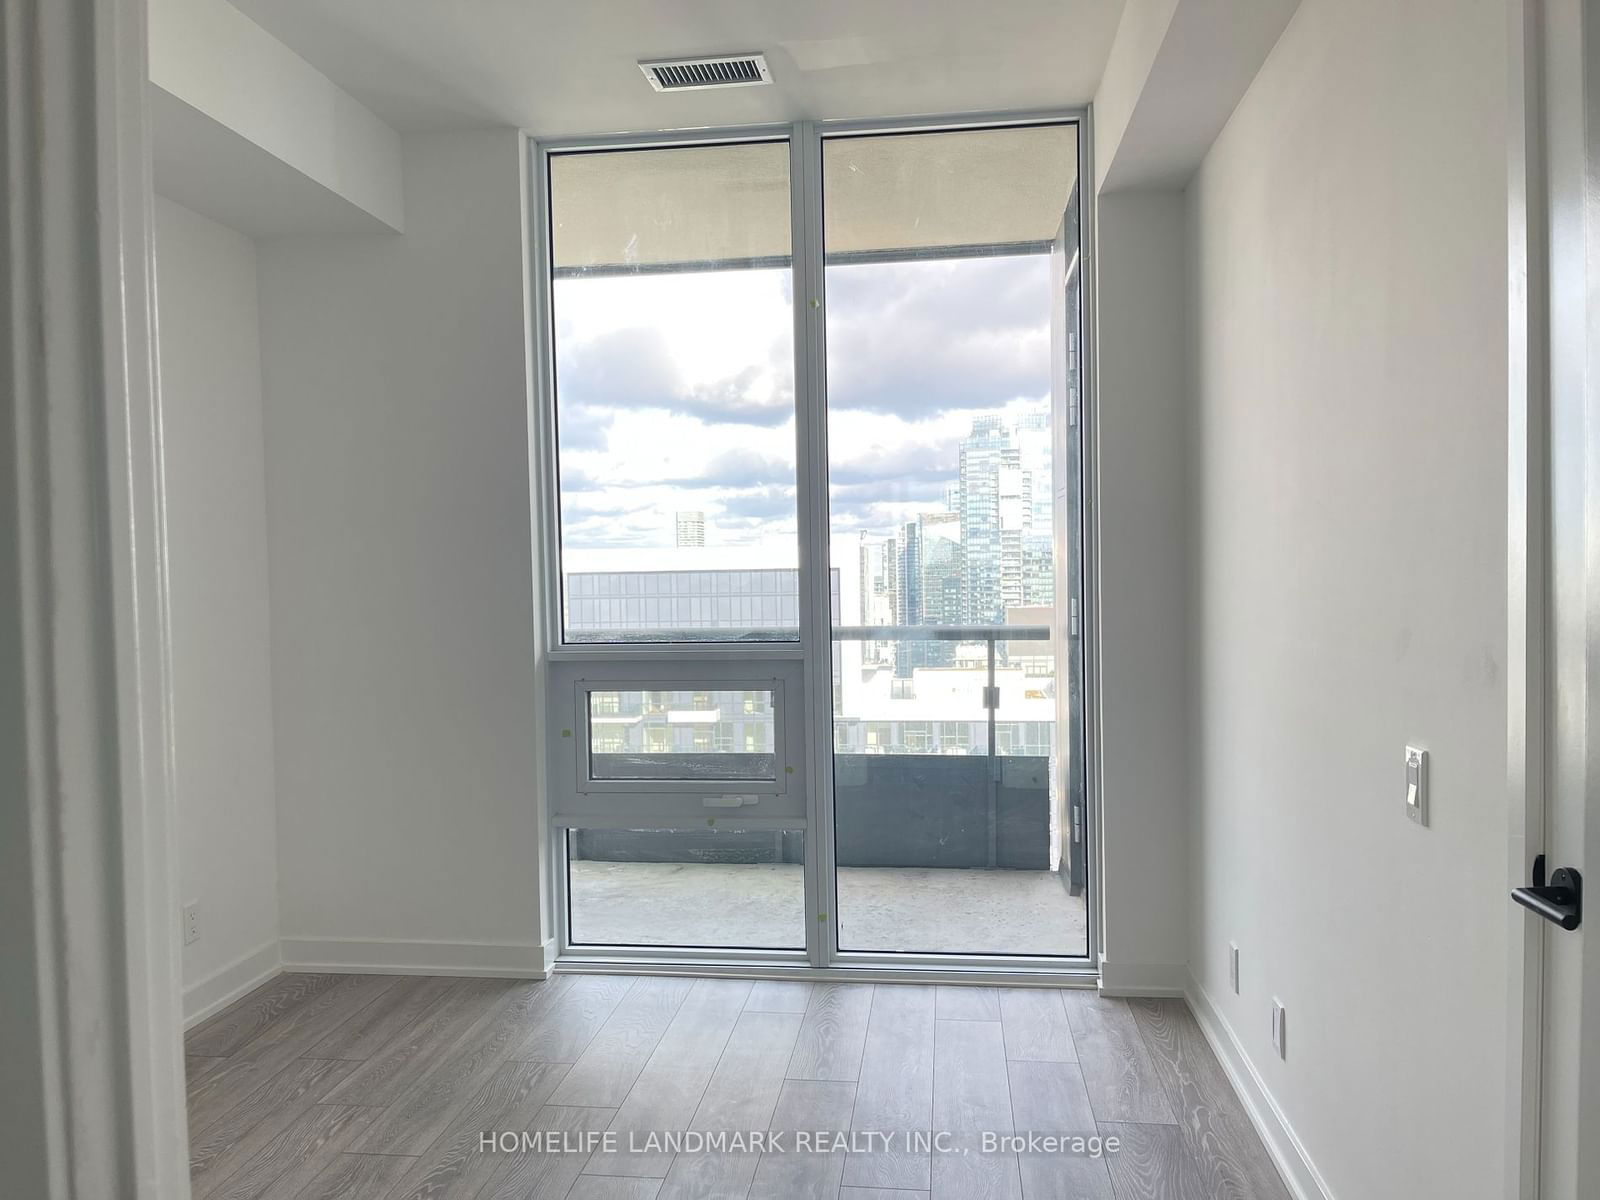
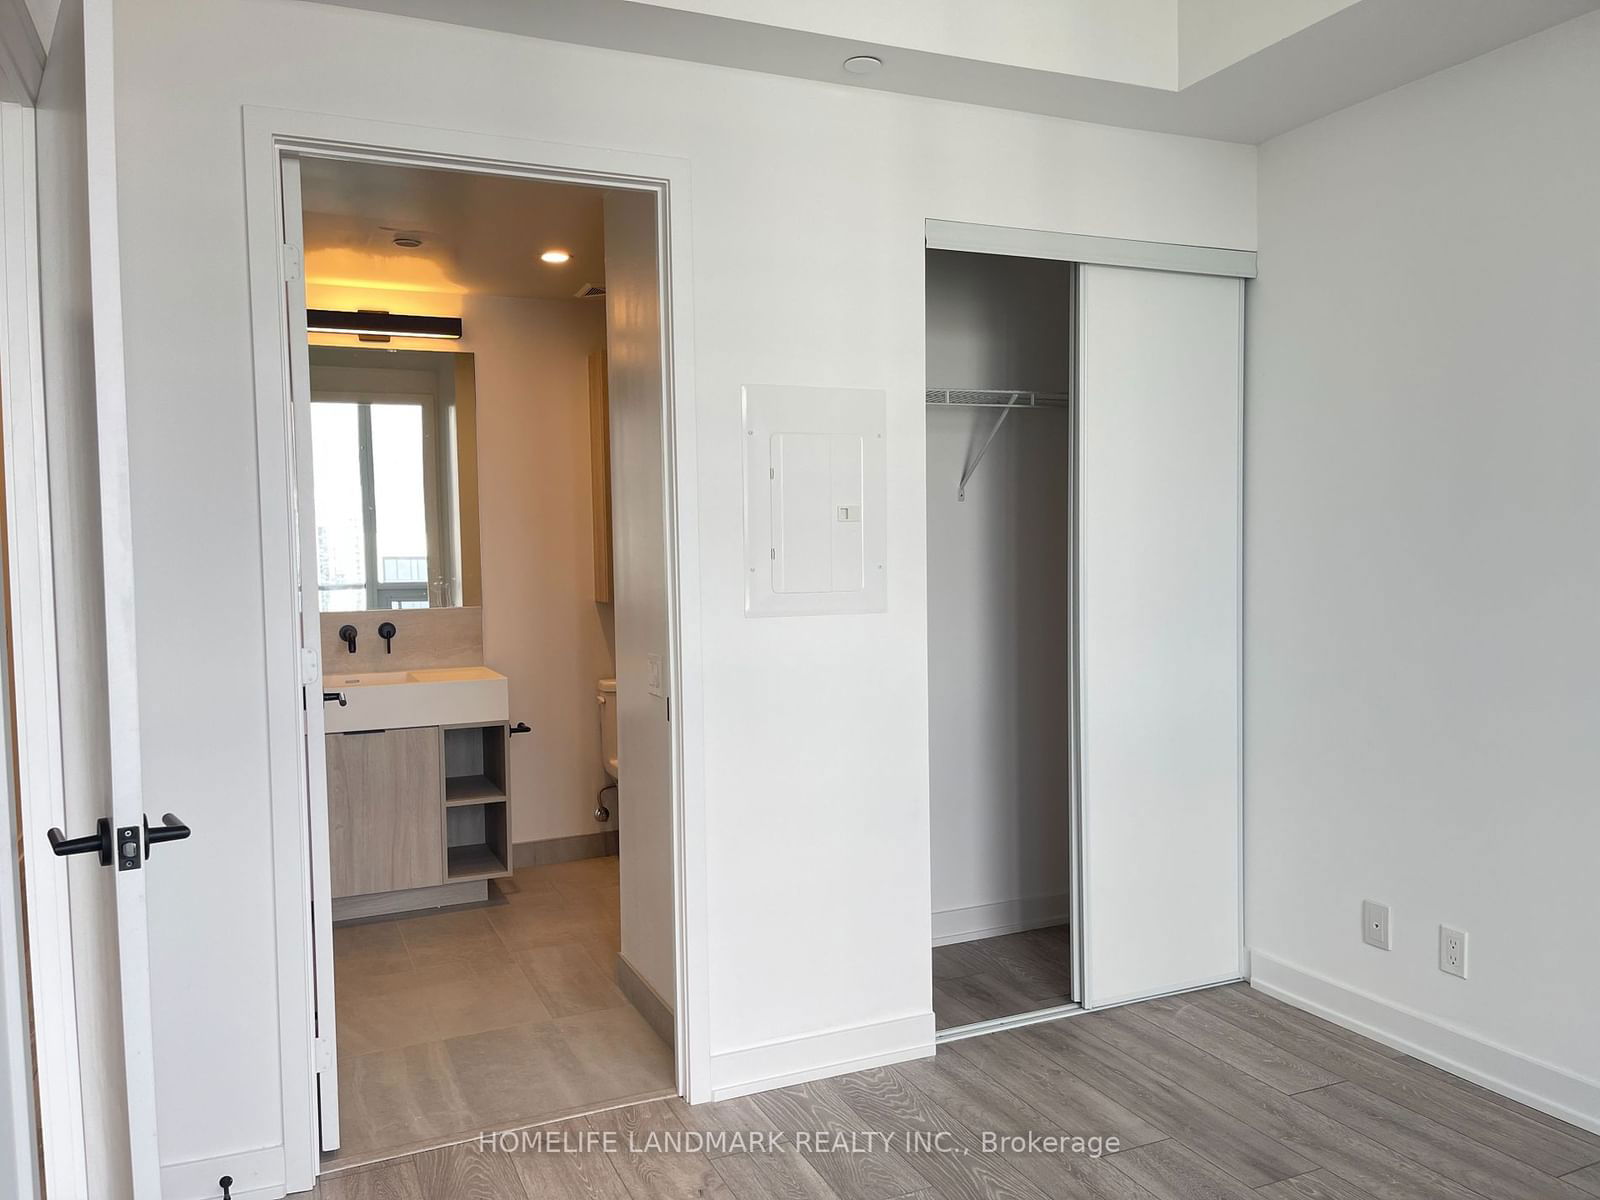
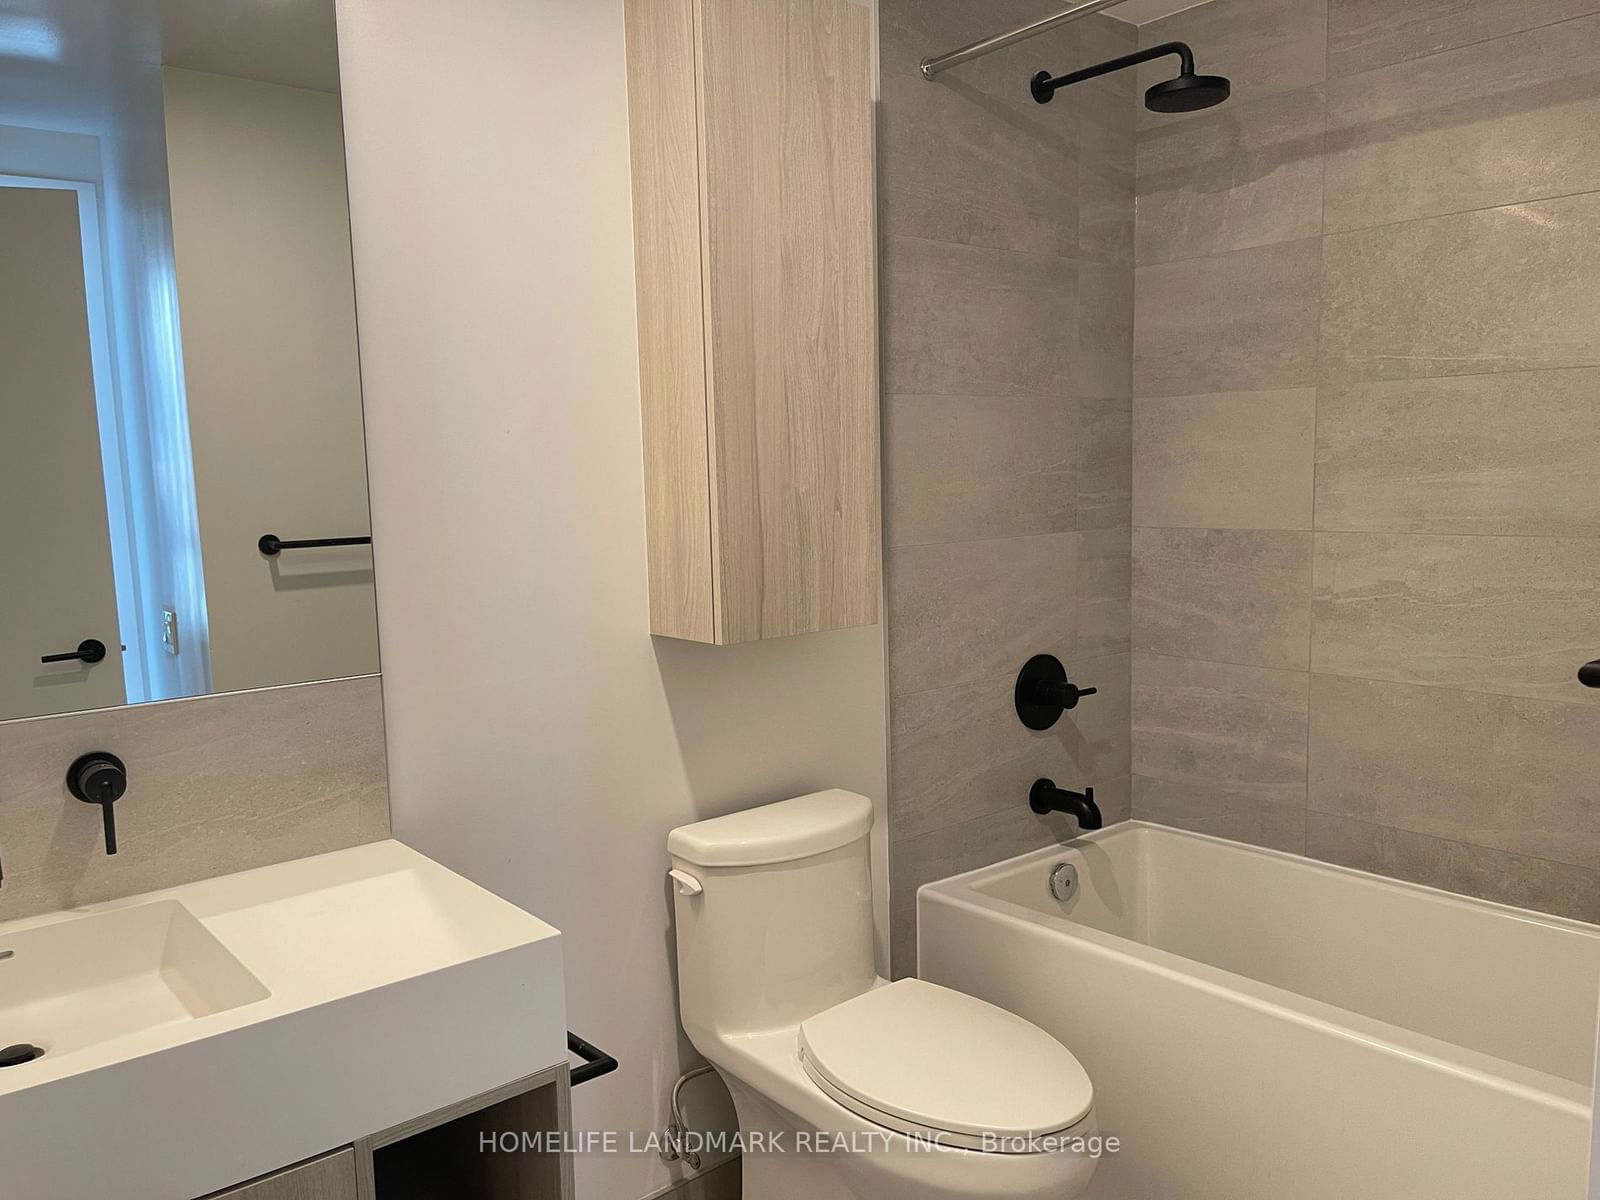
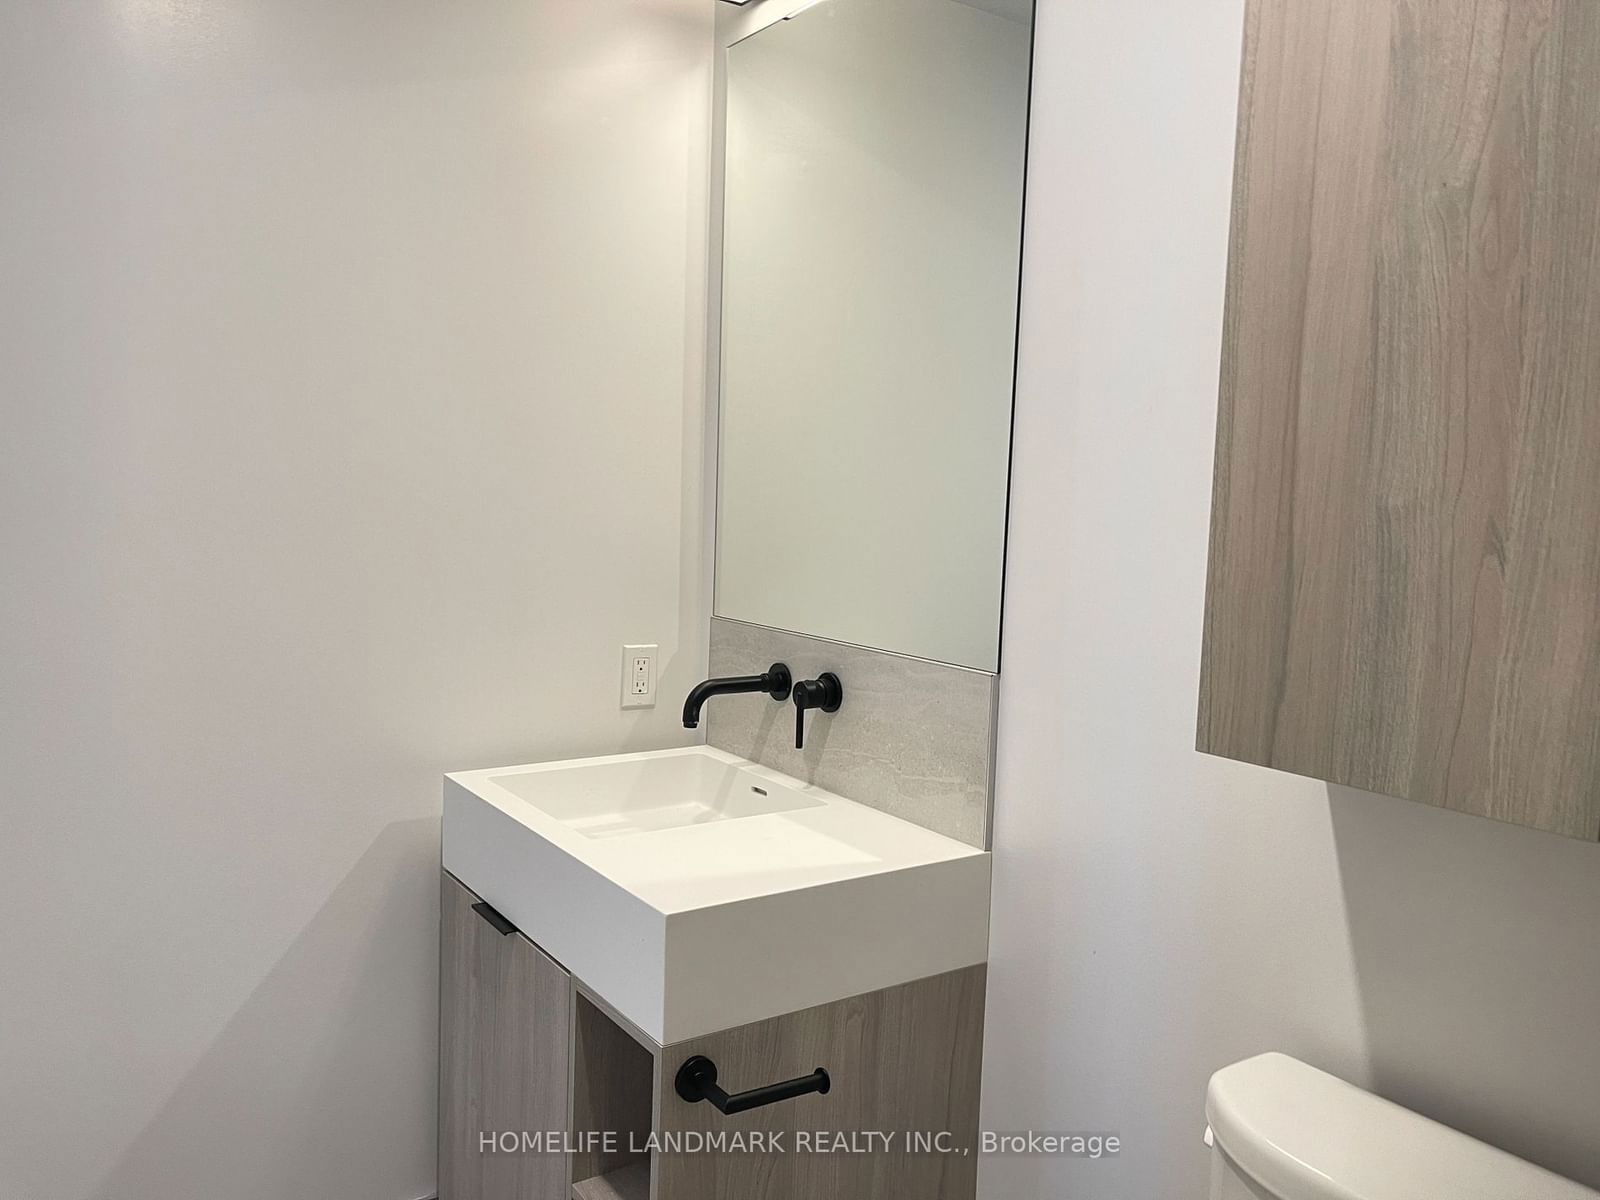
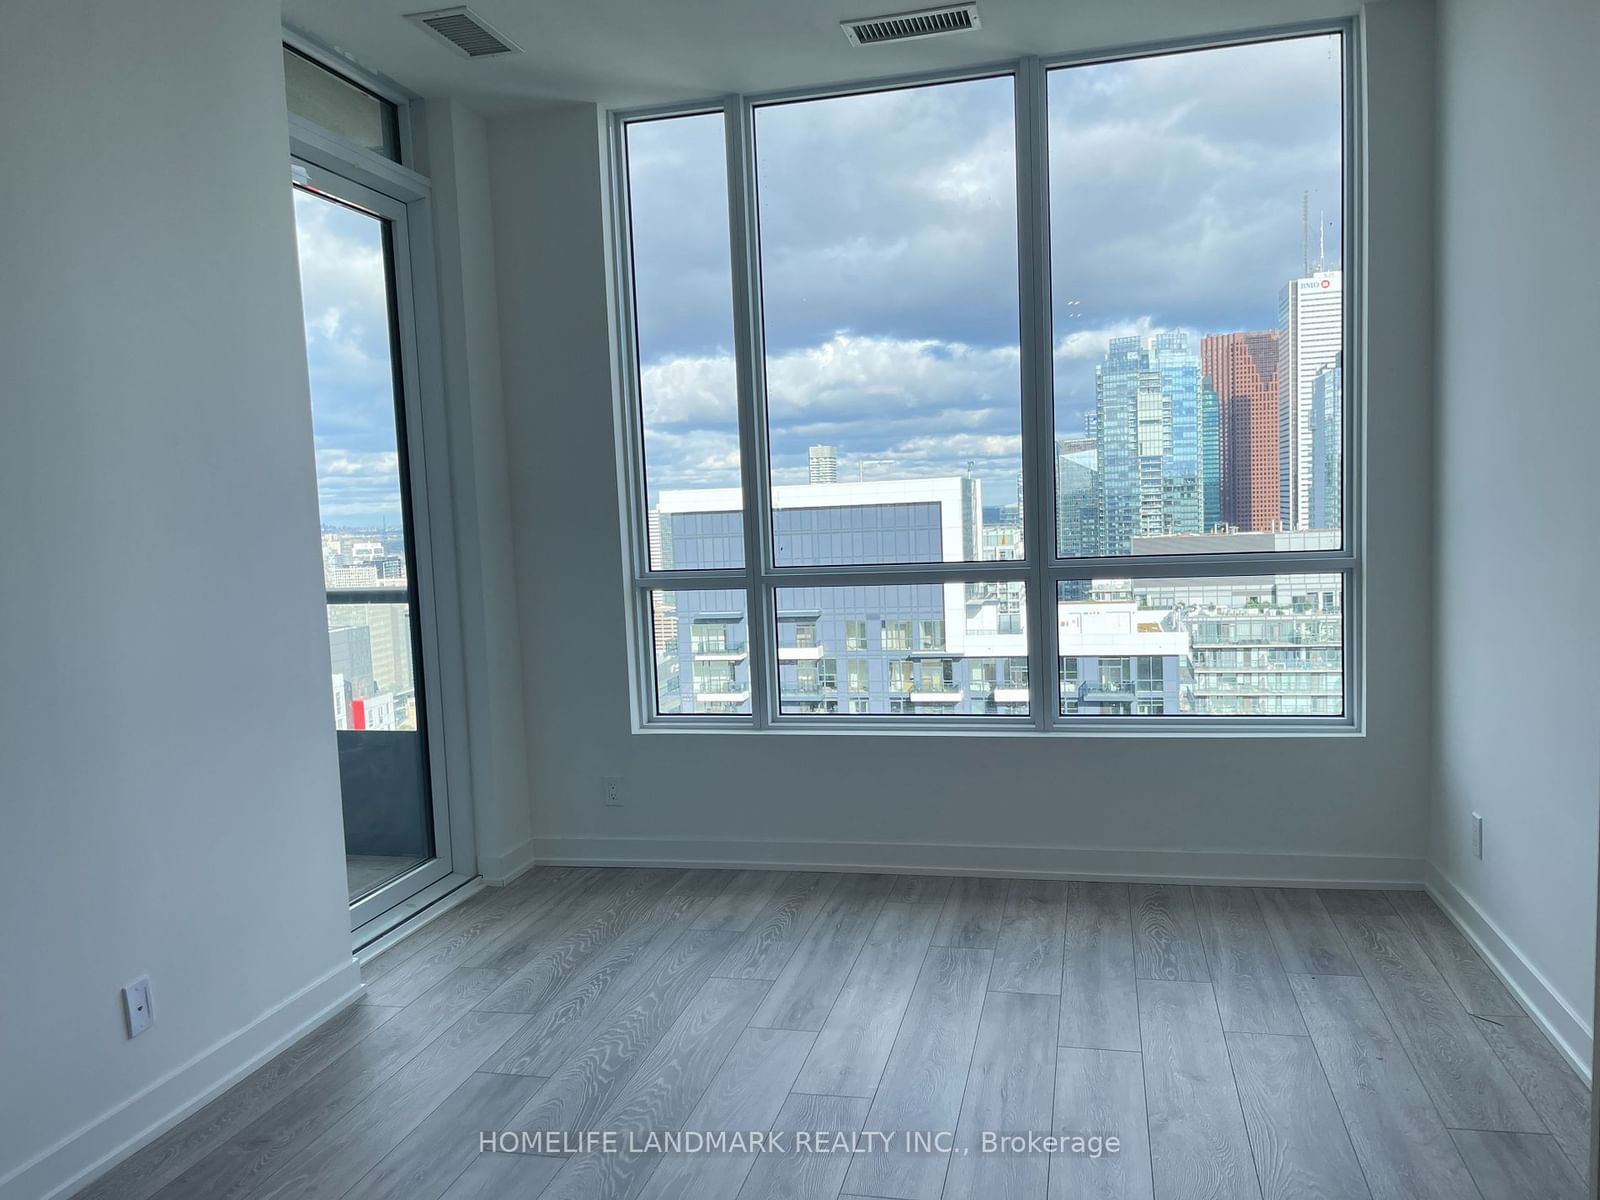
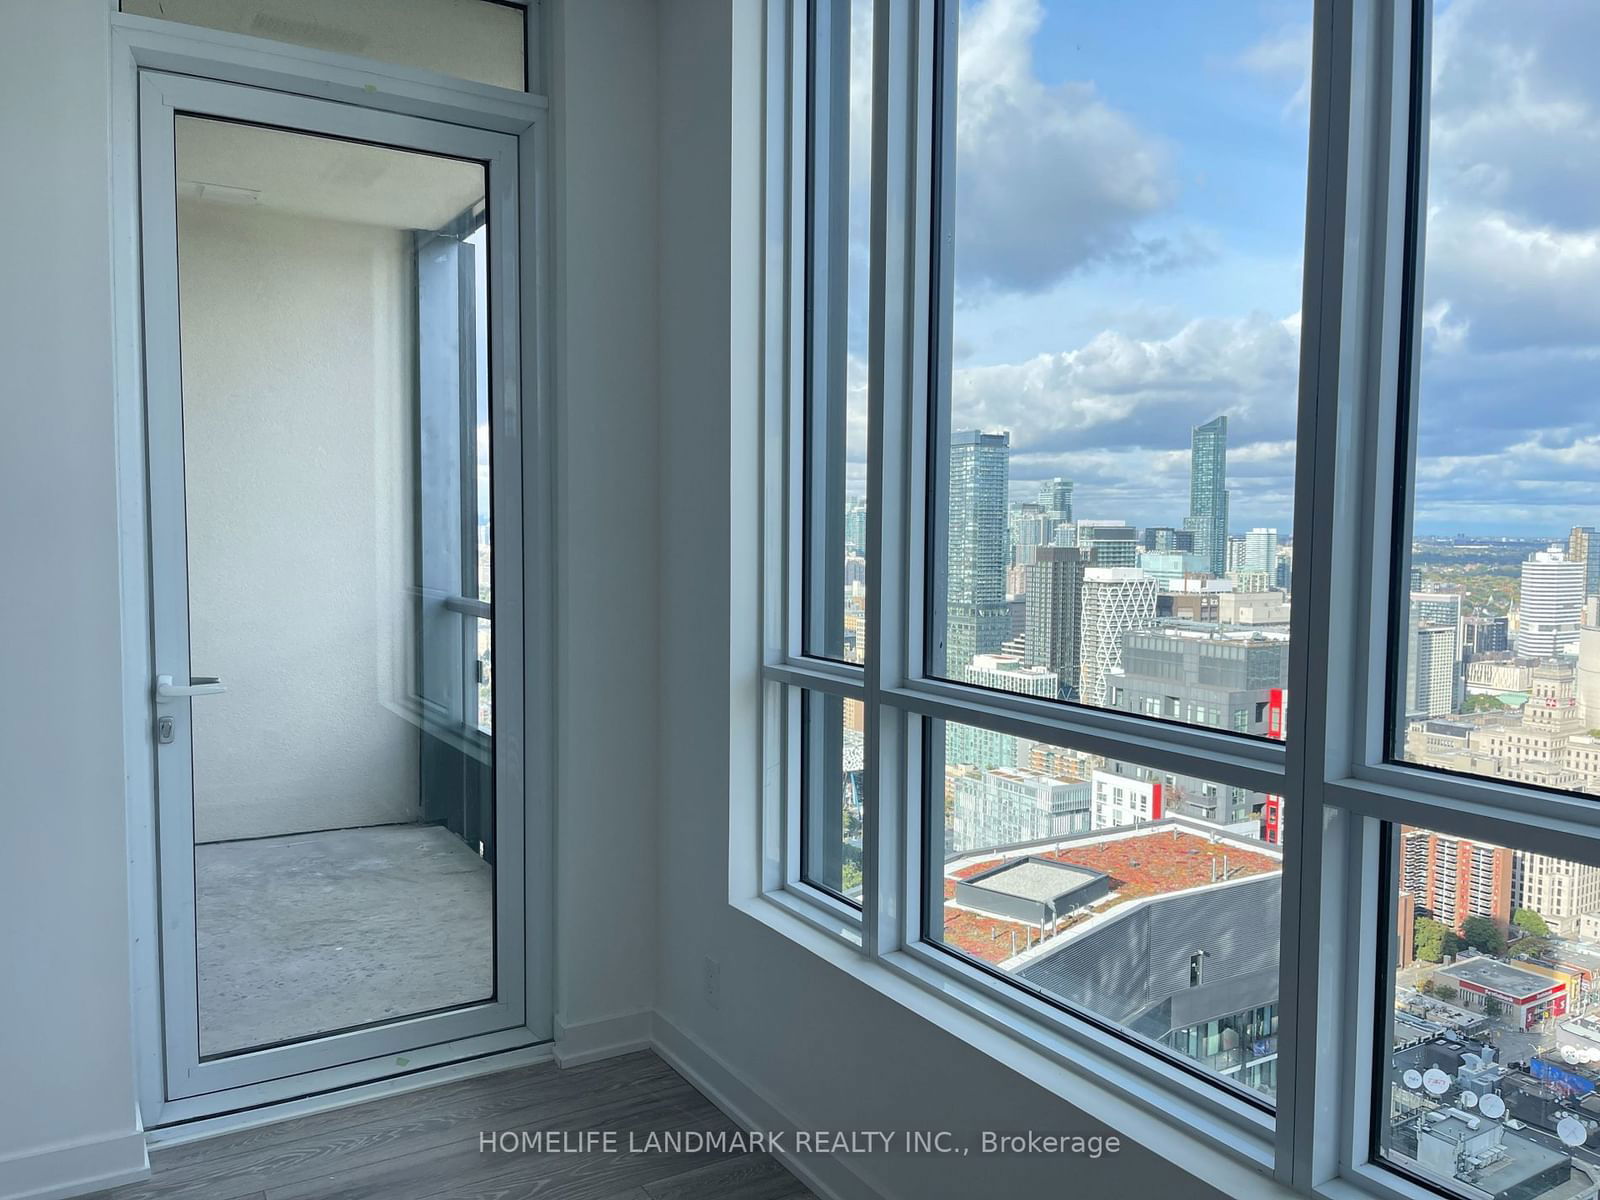
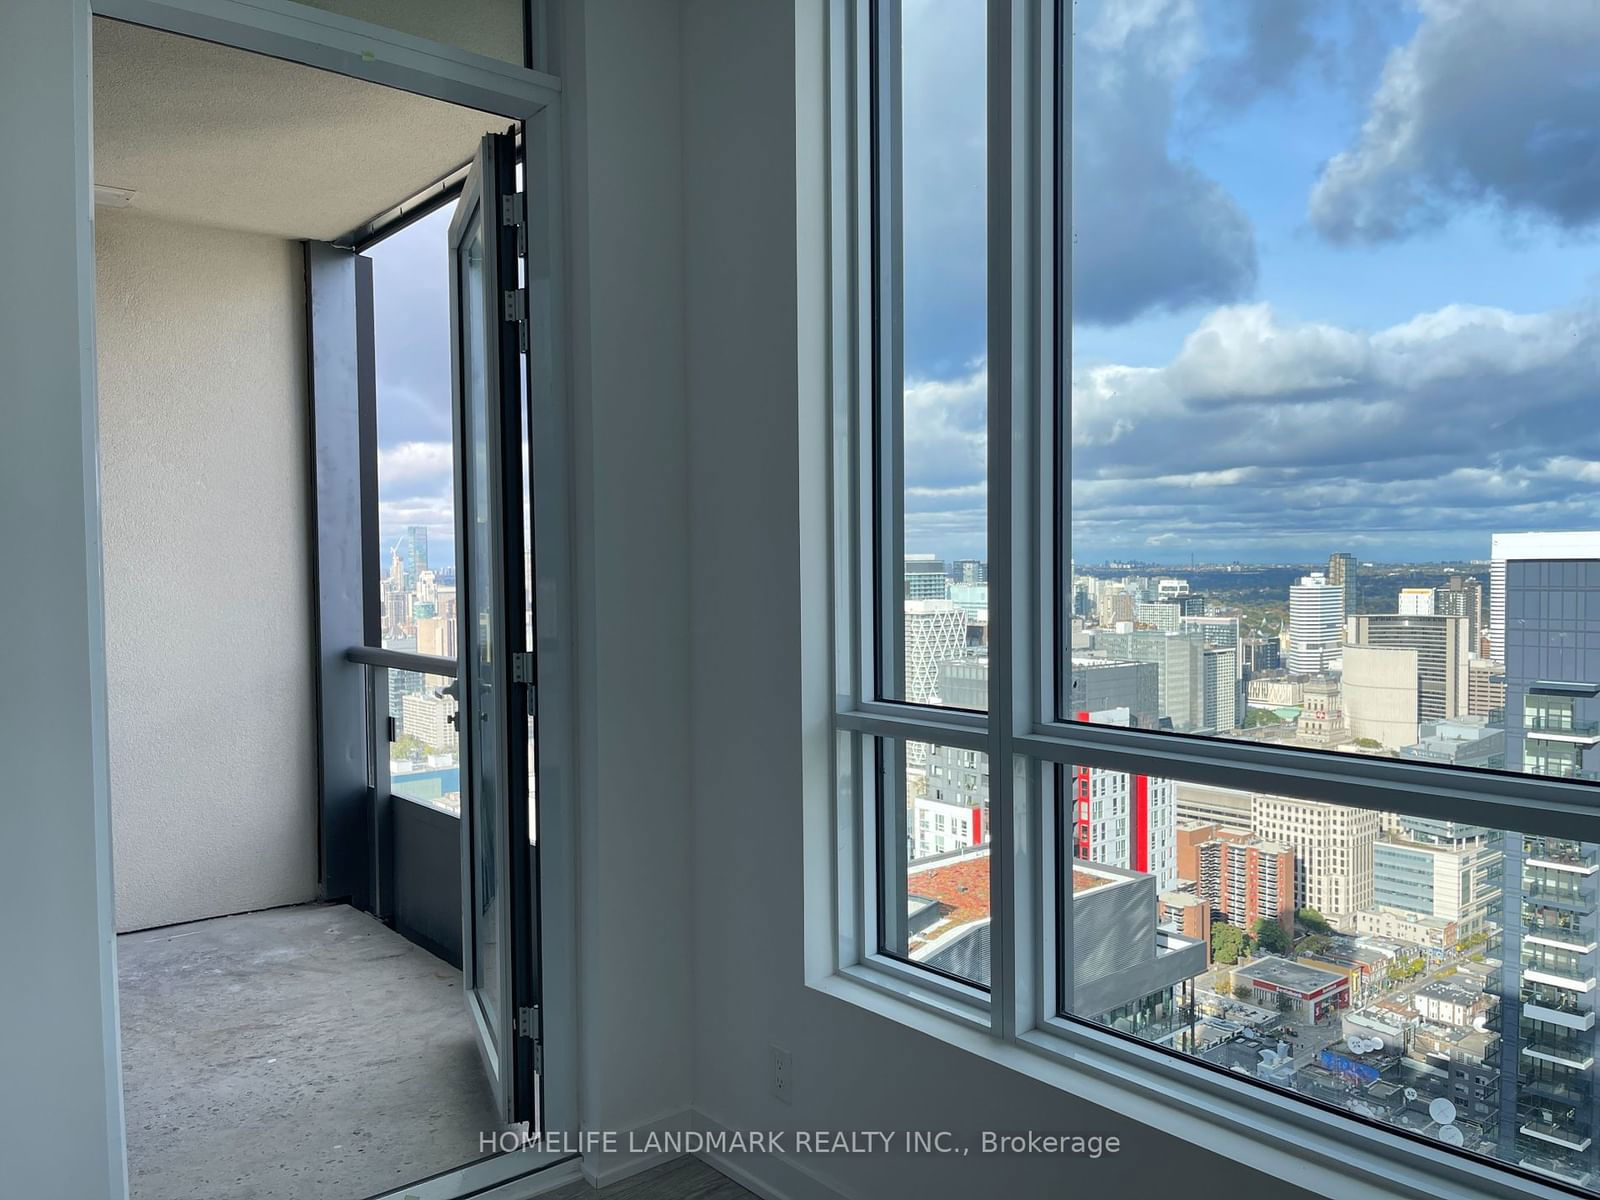
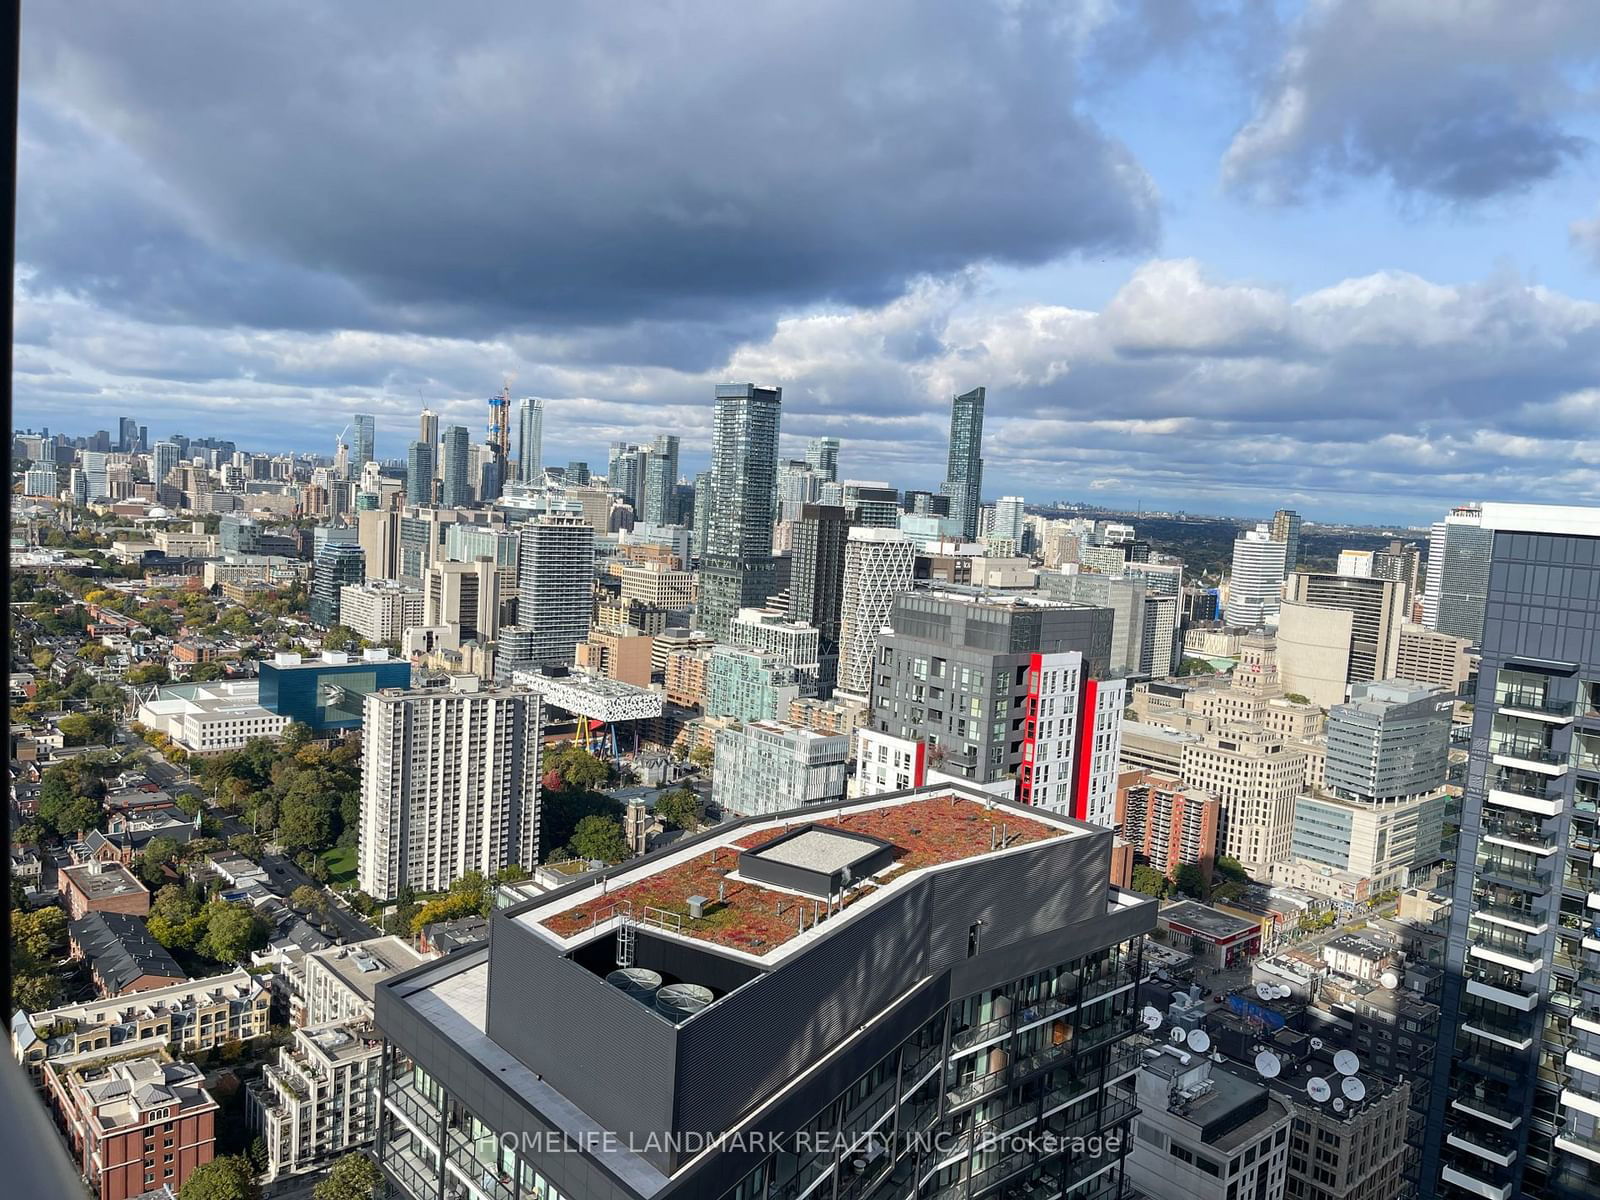
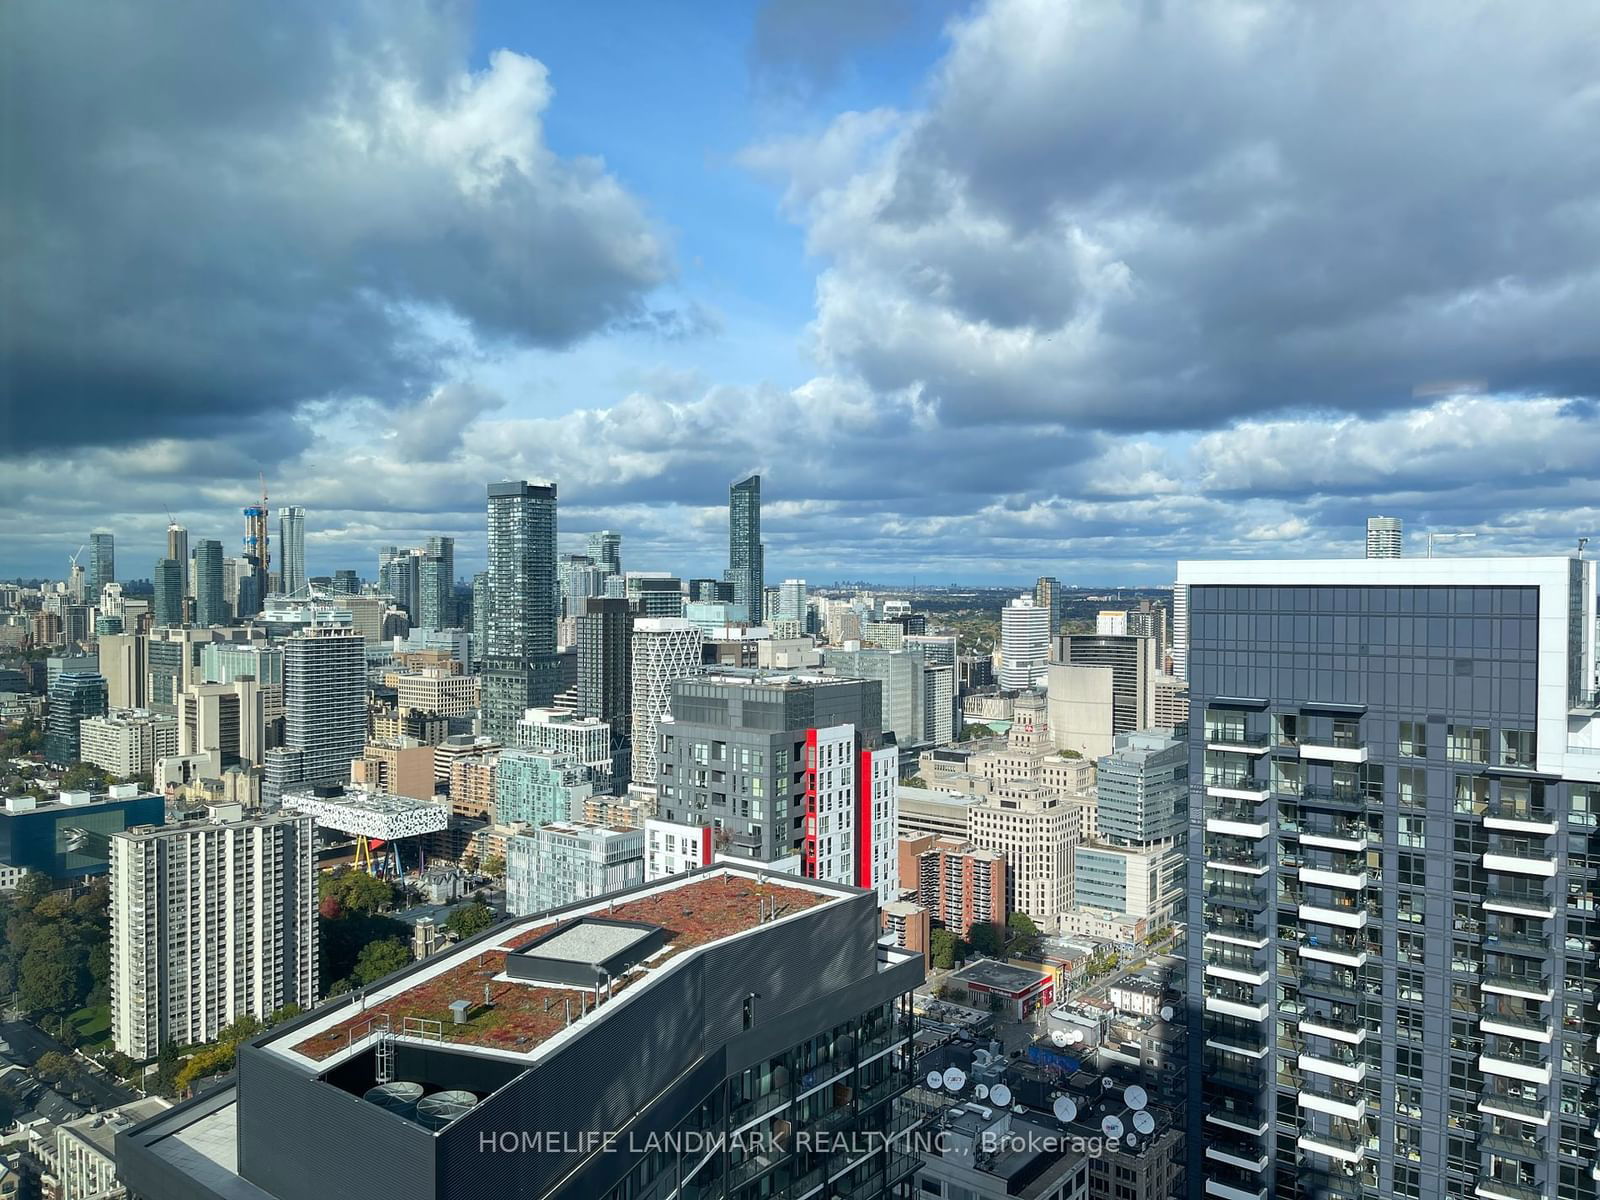
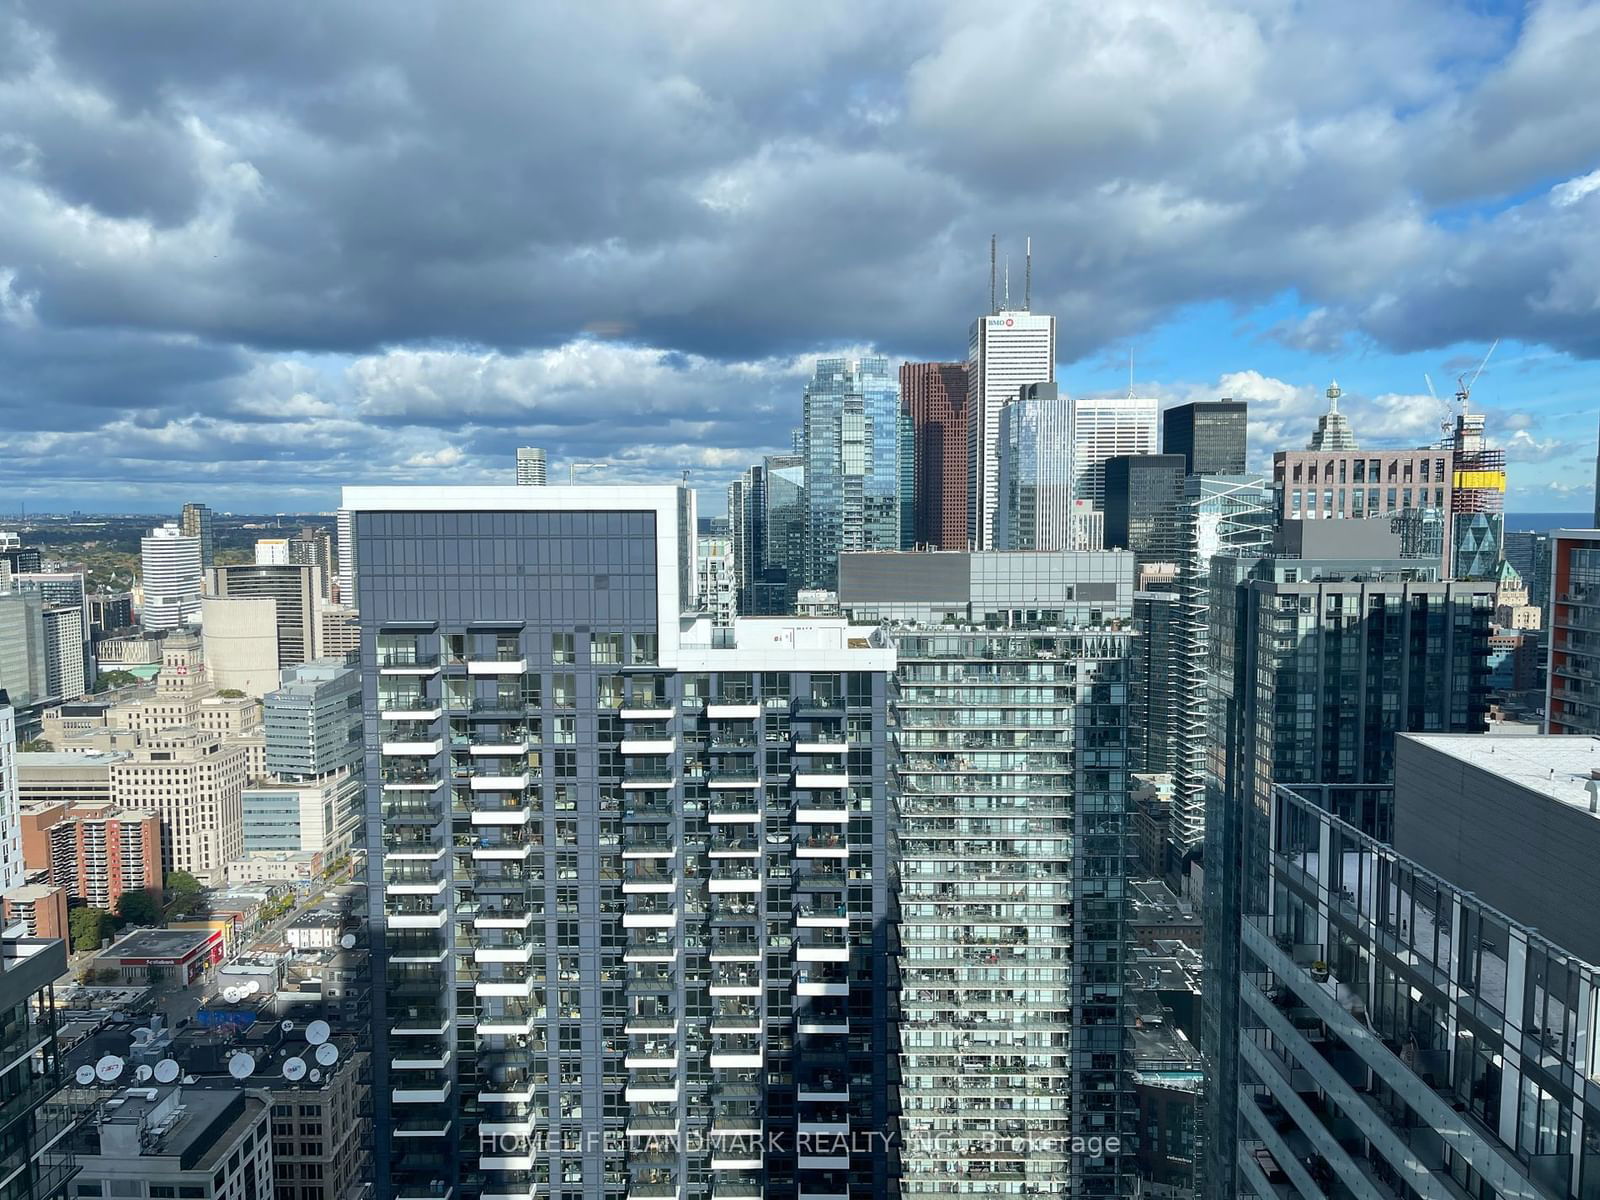
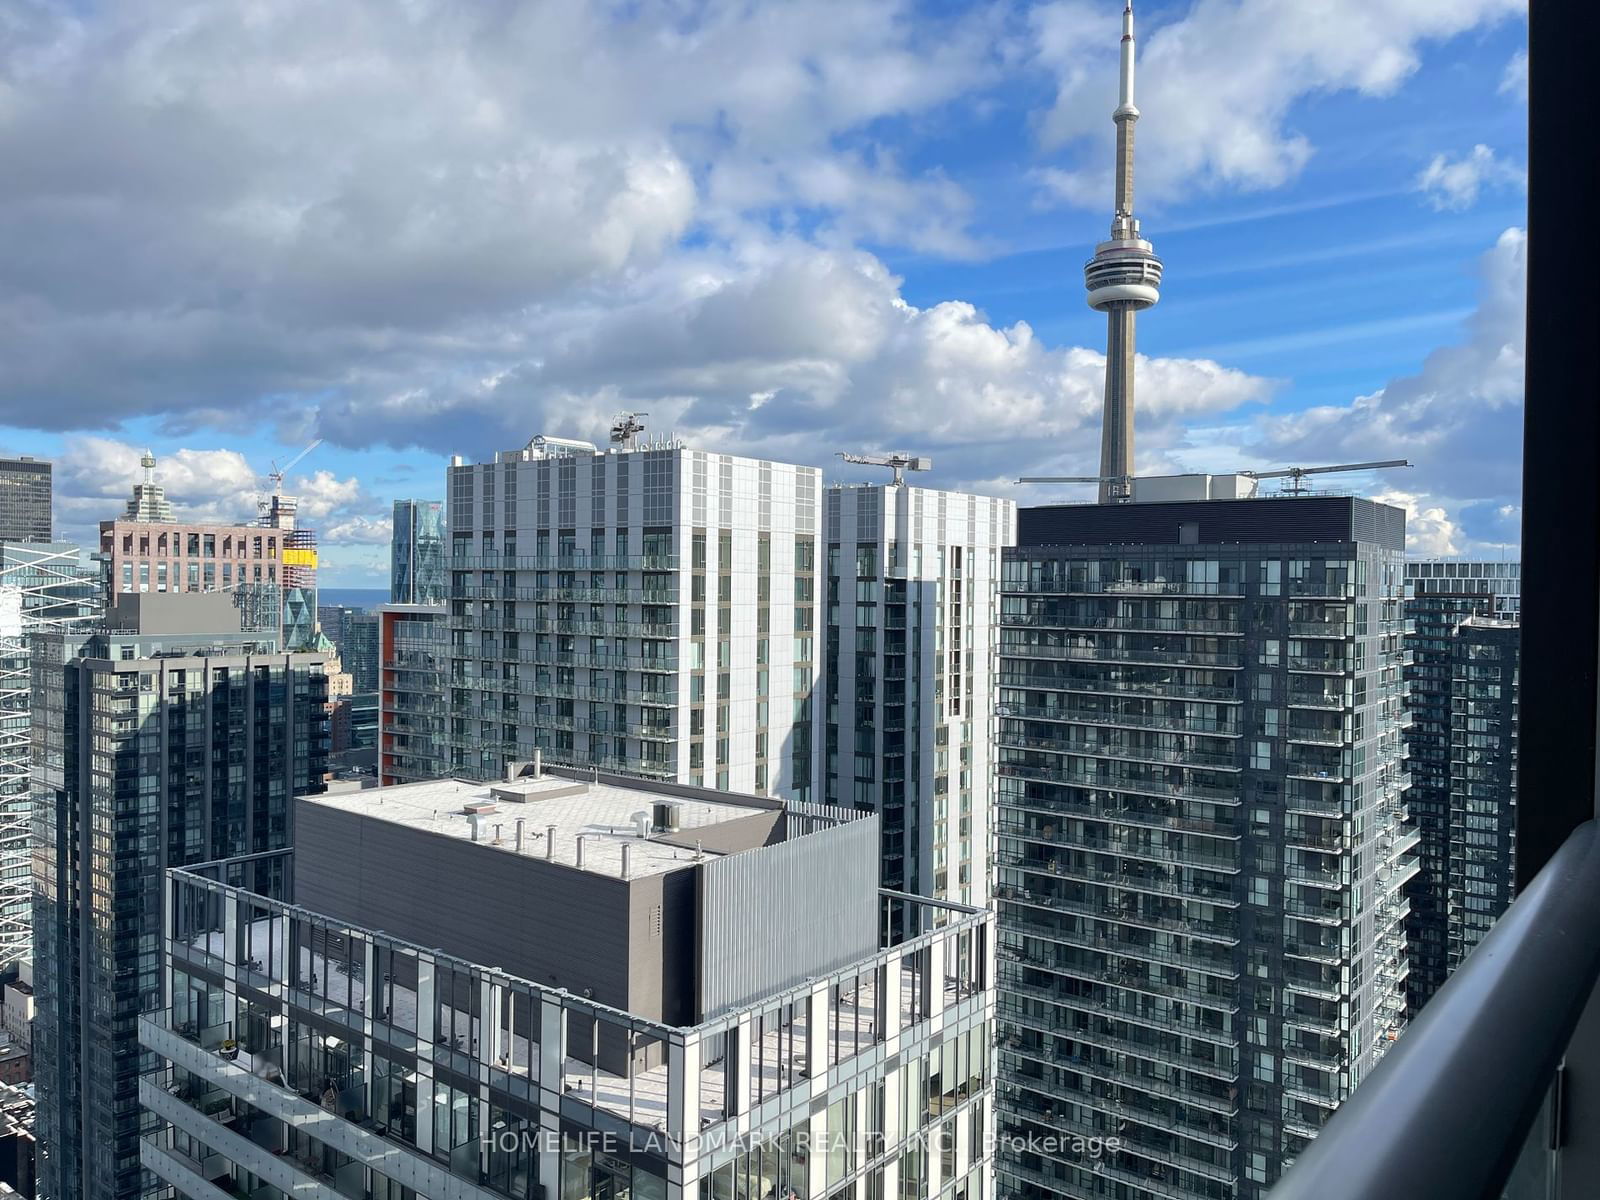
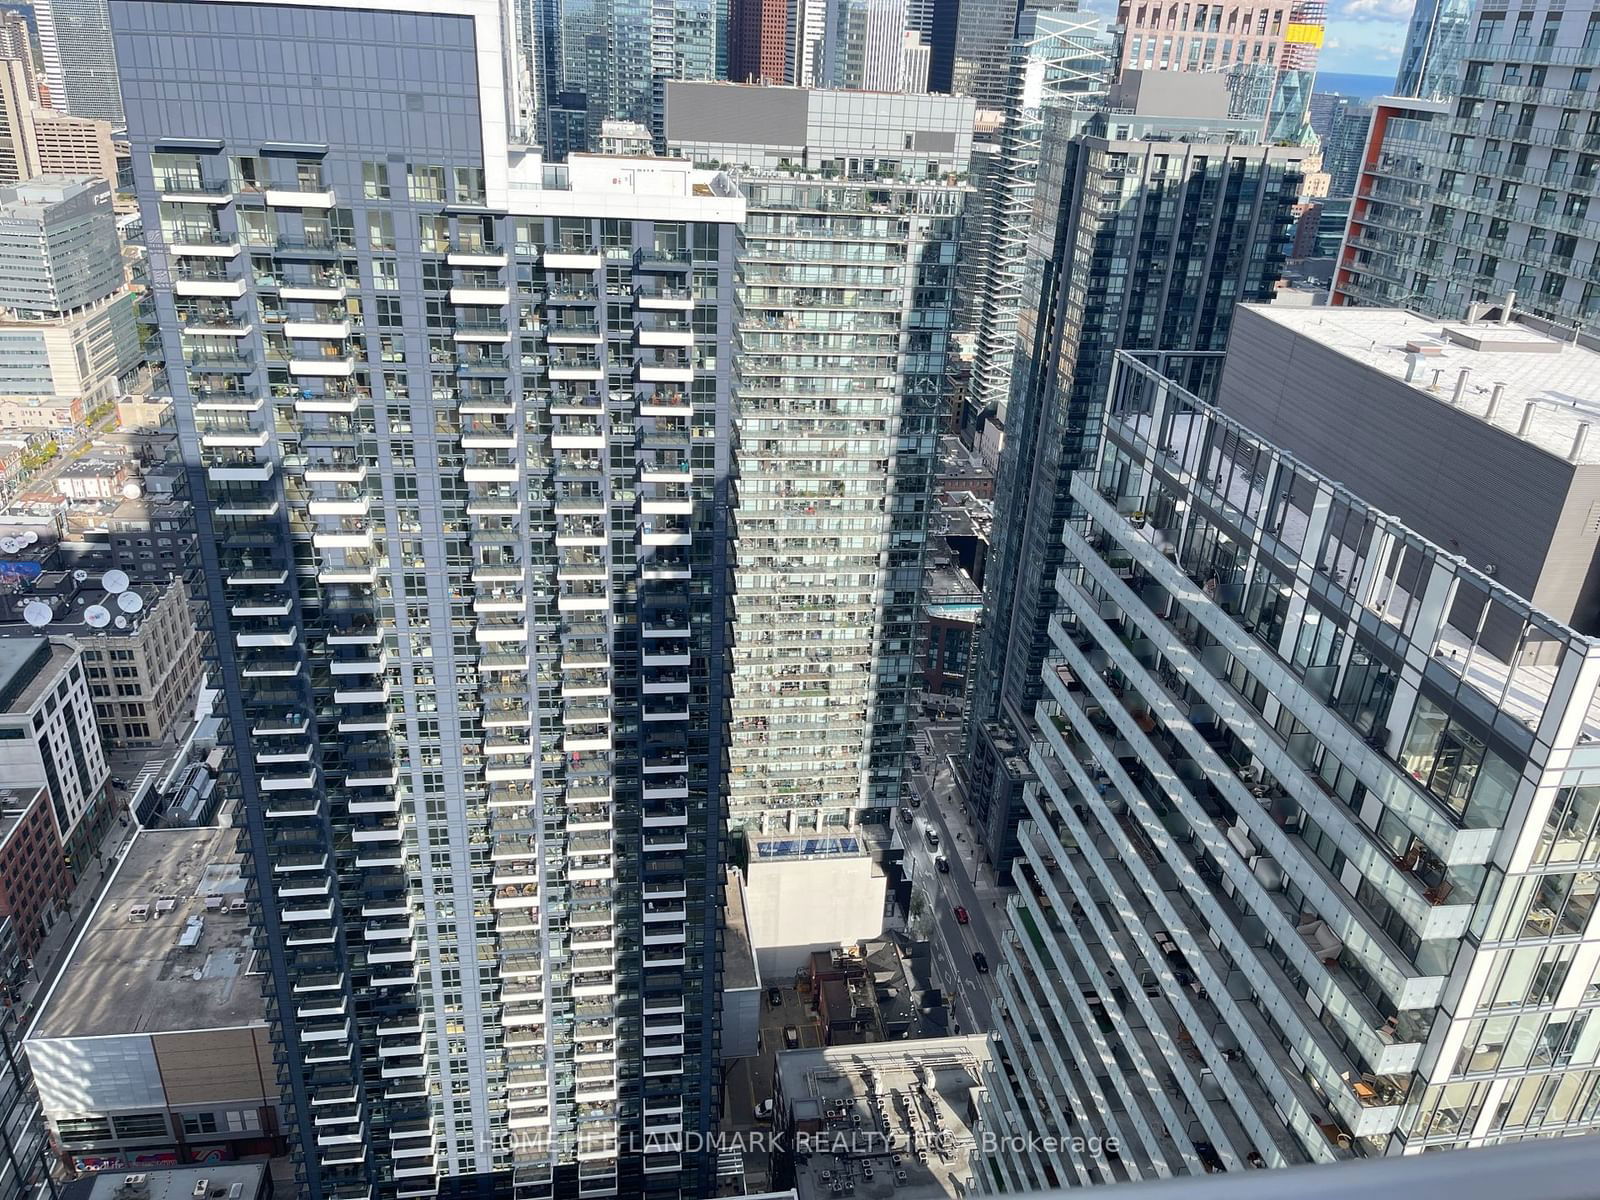
Welcome To This Brand New Unit Located In The Heart Of Downtown At Peter & Adelaide. Spacious 2 Bedroom 2 Full Bathroom Layout, 52th Floor 9 Feet Ceiling With Large Windows And Open Balcony, East Facing With Unobstructed City View, Open Concept Modern Kitchen With Built-in appliances, Amenities include: Co-working & Rec Room, Outdoor Lounge, Fitness & Yoga Studio, Infra-Red Sauna & Treatment Rooms, Demo Kitchen, Private Dining Room, Party Lounge, Terrace, Outdoor Communal Dining and Kids Zone & Arts & Crafts. Walking Distance To Grocery, Restaurants, Bars, Theatres, Transit, PATH, Union Station And Chinatown. Bus Stop At The Corner Of the Building, Minutes Drive To DVP High Way And QEW High Way, Very Conveniences Location!
homelife landmark realty inc.MLS® #C10420668
Amenities
Explore Neighbourhood
Similar Listings
Demographics
Based on the dissemination area as defined by Statistics Canada. A dissemination area contains, on average, approximately 200 – 400 households.
Price Trends
Maintenance Fees
Building Trends At Peter & Adelaide Condos
Days on Strata
List vs Selling Price
Offer Competition
Turnover of Units
Property Value
Price Ranking
Sold Units
Rented Units
Best Value Rank
Appreciation Rank
Rental Yield
High Demand
Transaction Insights at 350 Adelaide Street W
| Studio | 1 Bed | 1 Bed + Den | 2 Bed | 2 Bed + Den | 3 Bed | 3 Bed + Den | |
|---|---|---|---|---|---|---|---|
| Price Range | No Data | $485,000 - $635,000 | $590,000 - $770,000 | $720,000 - $1,070,000 | $893,000 | $875,000 - $1,340,000 | No Data |
| Avg. Cost Per Sqft | No Data | $1,250 | $1,221 | $1,179 | $1,298 | $1,192 | No Data |
| Price Range | No Data | $1,500 - $2,700 | $2,250 - $3,200 | $1,380 - $3,500 | $2,950 - $3,700 | $1,350 - $5,450 | No Data |
| Avg. Wait for Unit Availability | No Data | 46 Days | 34 Days | 51 Days | No Data | 87 Days | No Data |
| Avg. Wait for Unit Availability | 22 Days | 5 Days | 3 Days | 3 Days | 11 Days | 10 Days | No Data |
| Ratio of Units in Building | 1% | 20% | 33% | 31% | 7% | 10% | 1% |
Transactions vs Inventory
Total number of units listed and leased in Queen West
