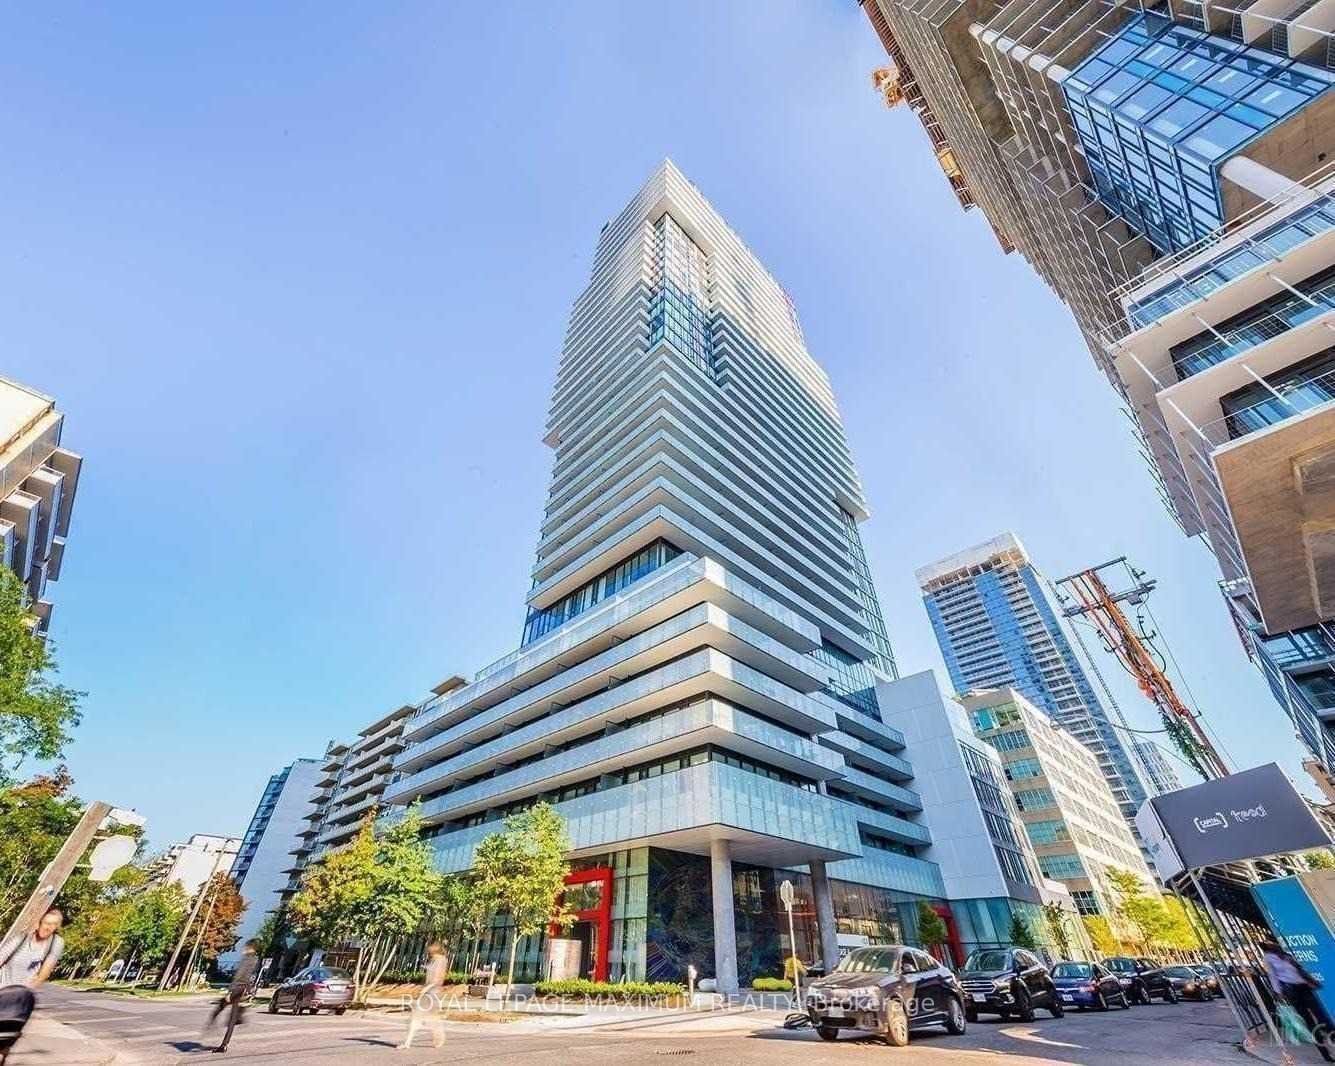
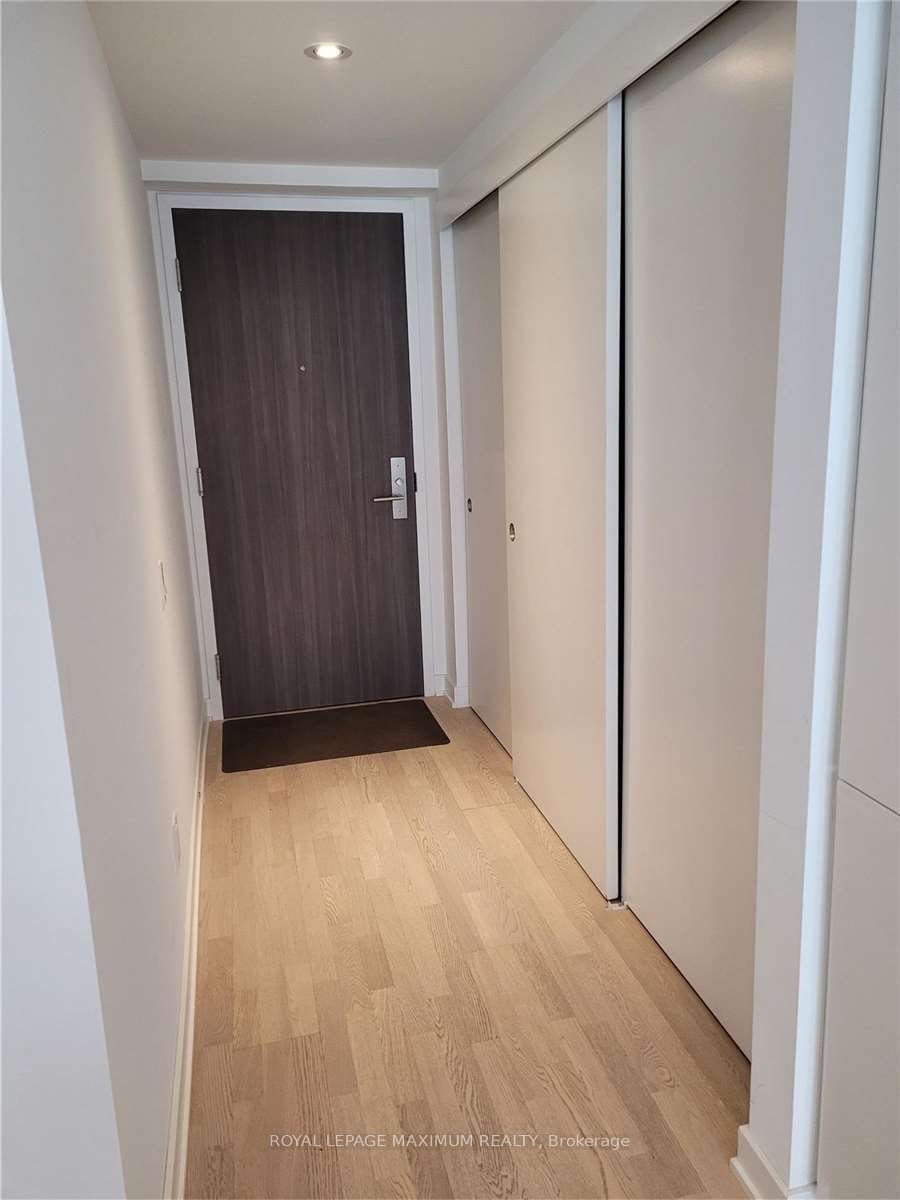
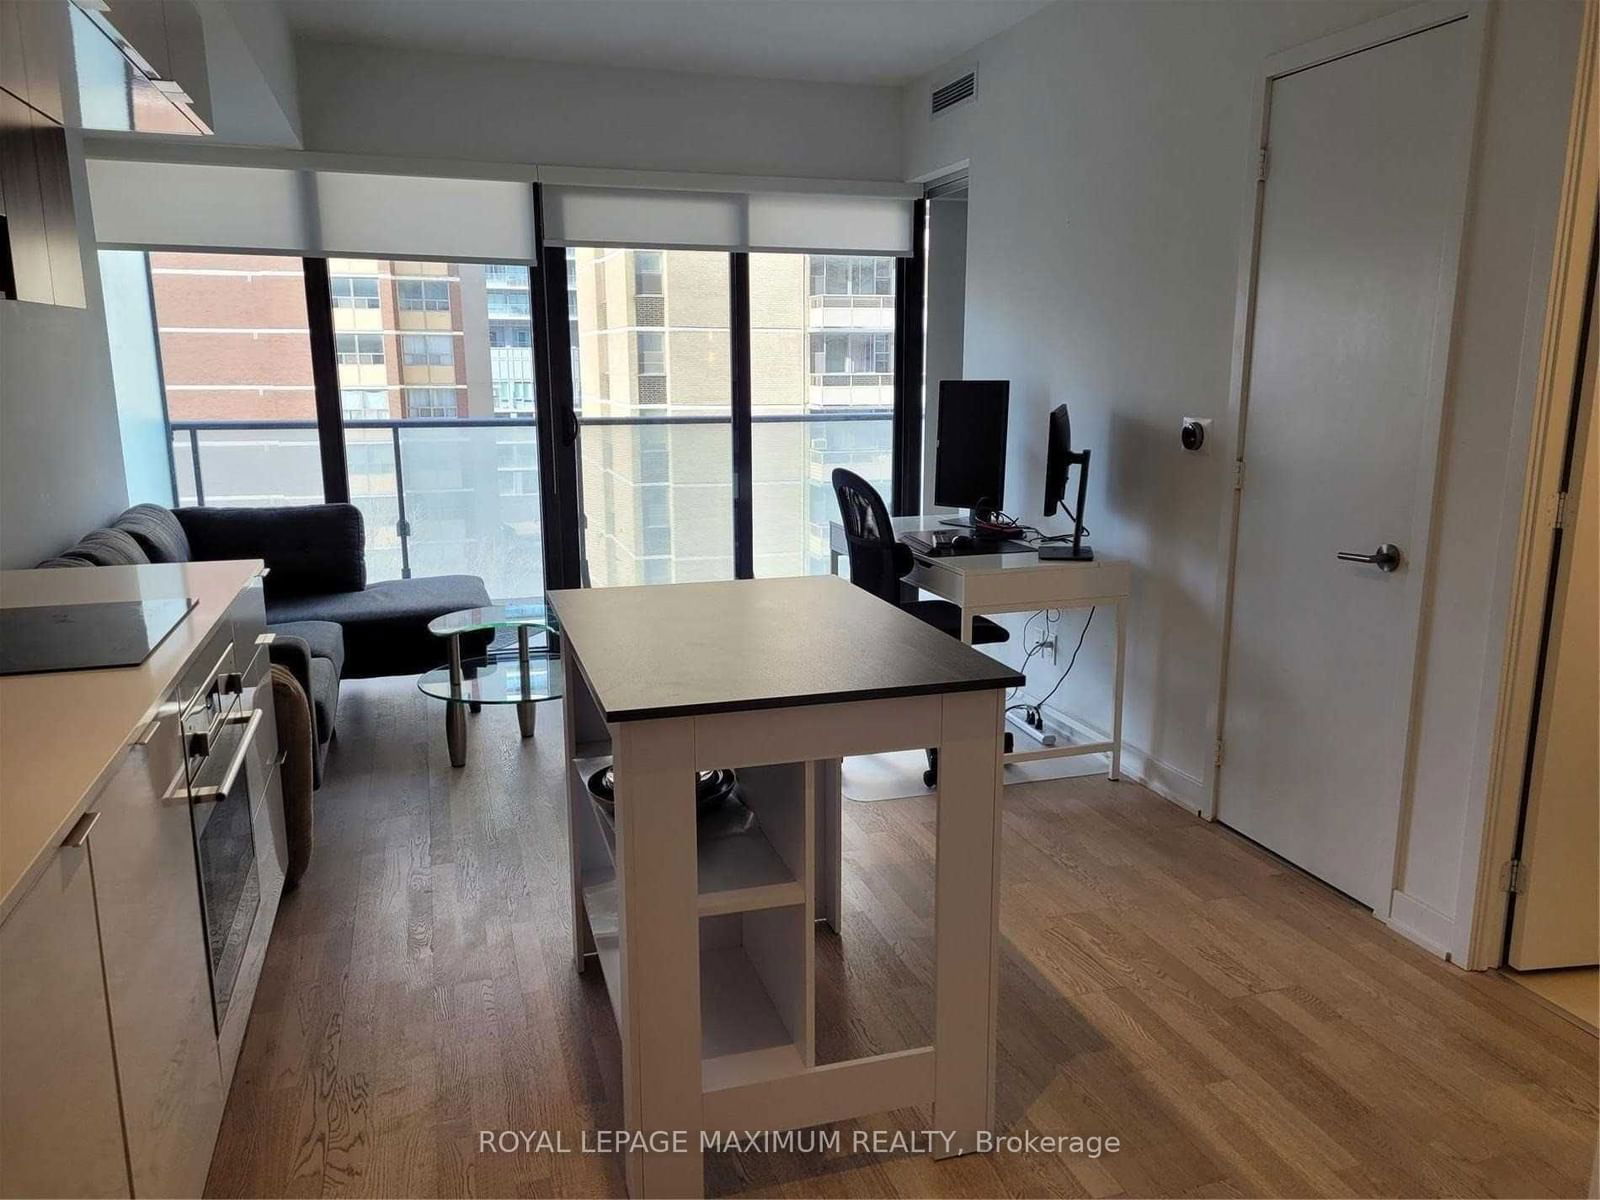
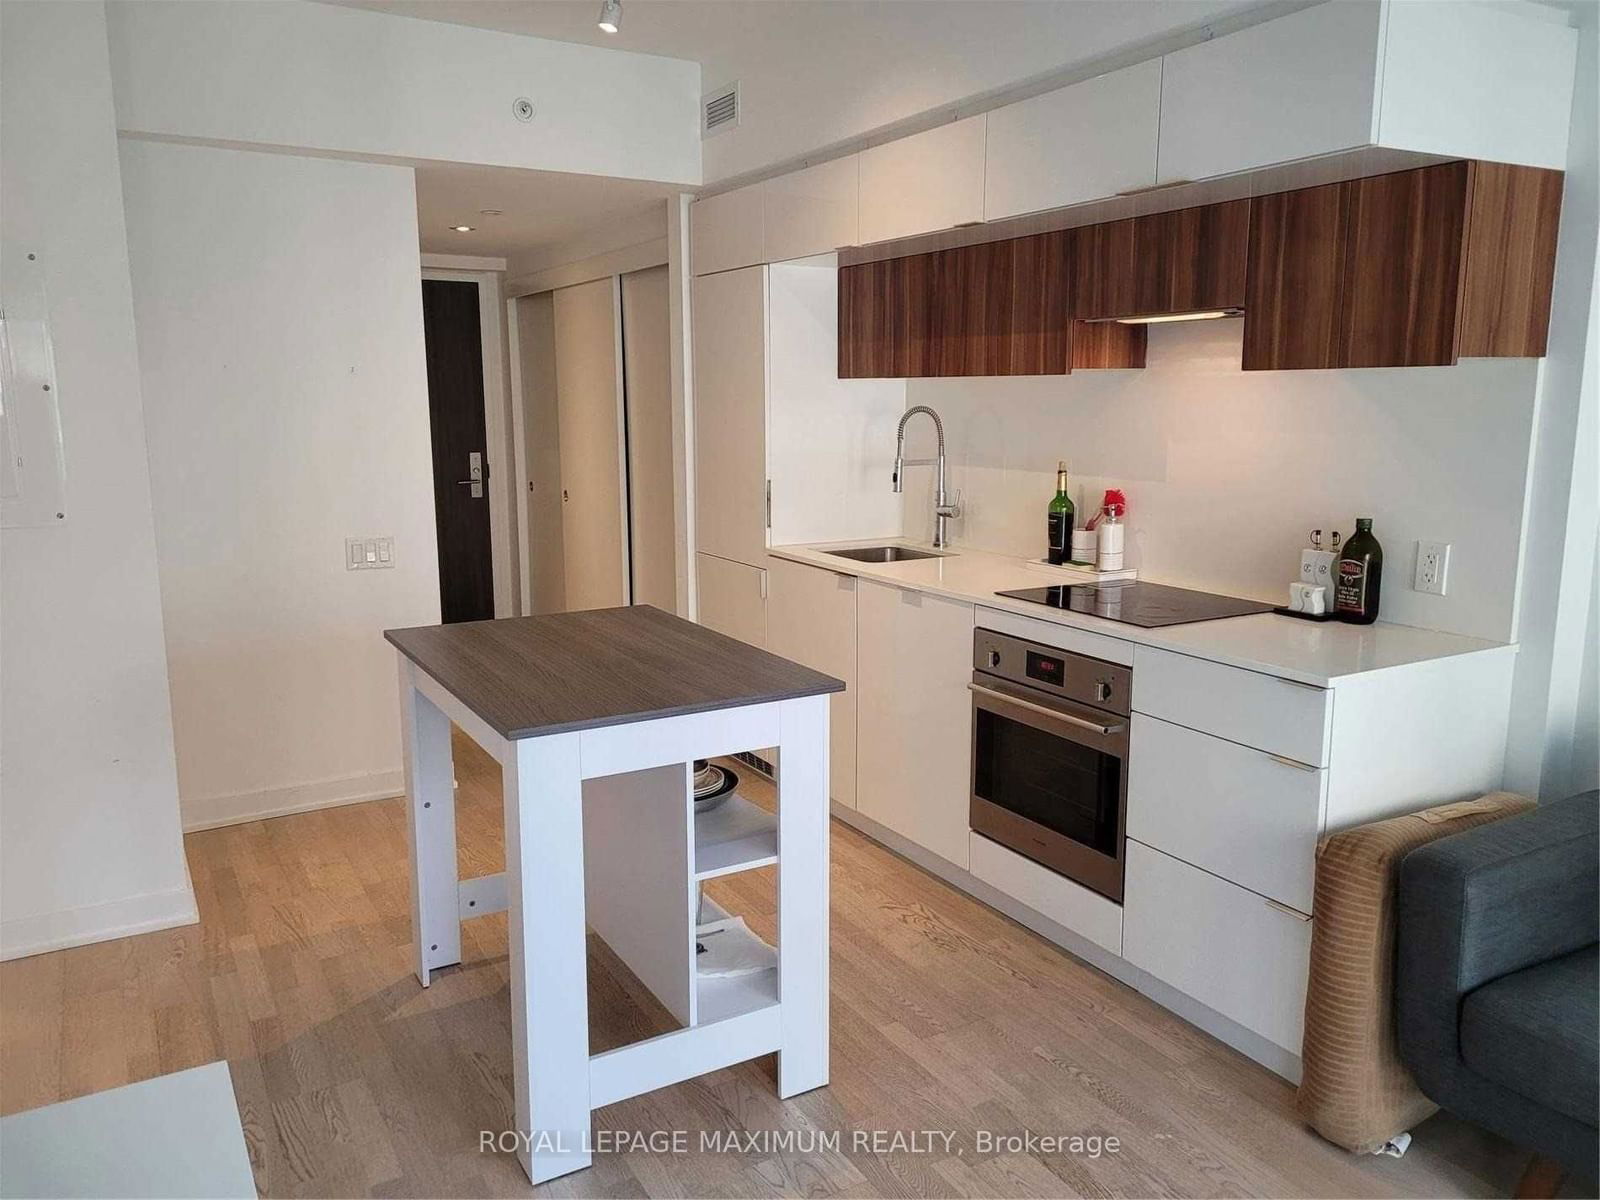
507 - 185 Roehampton Ave
Listing History
Unit Highlights
Utilities Included
Utility Type
- Air Conditioning
- Central Air
- Heat Source
- Gas
- Heating
- Forced Air
Room Dimensions
About this Listing
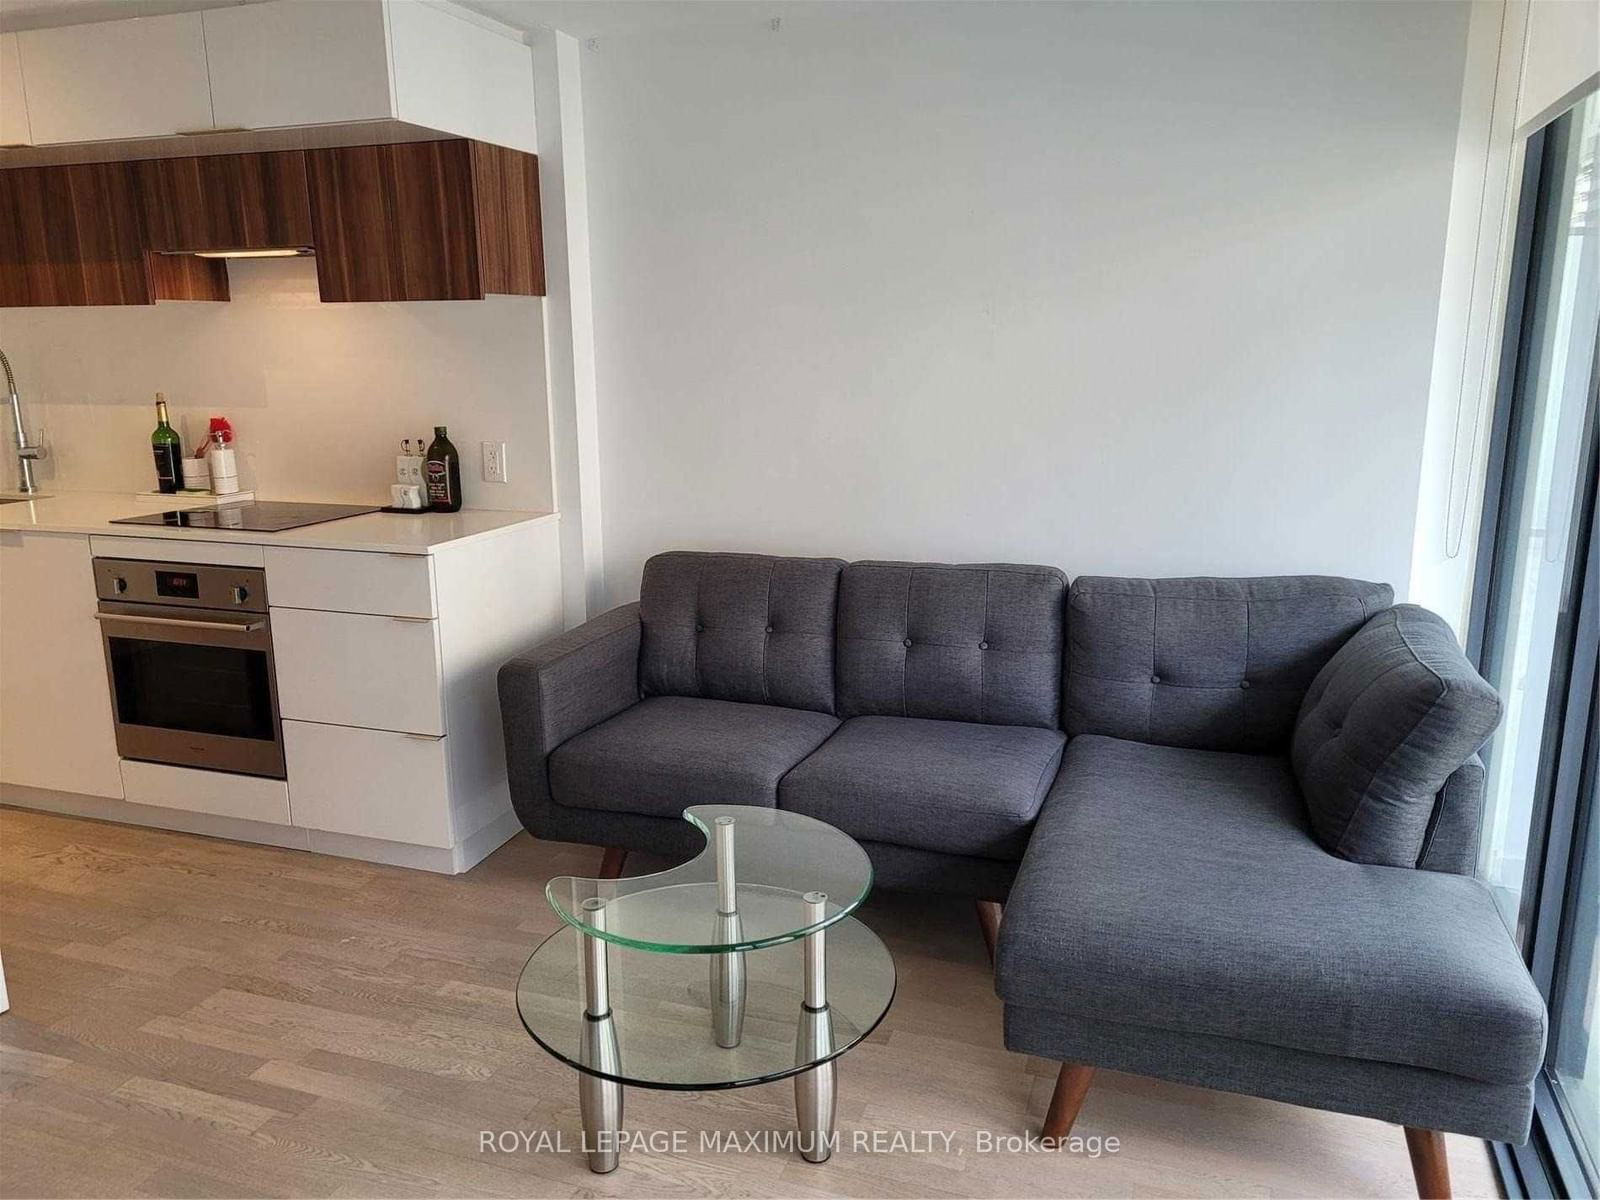
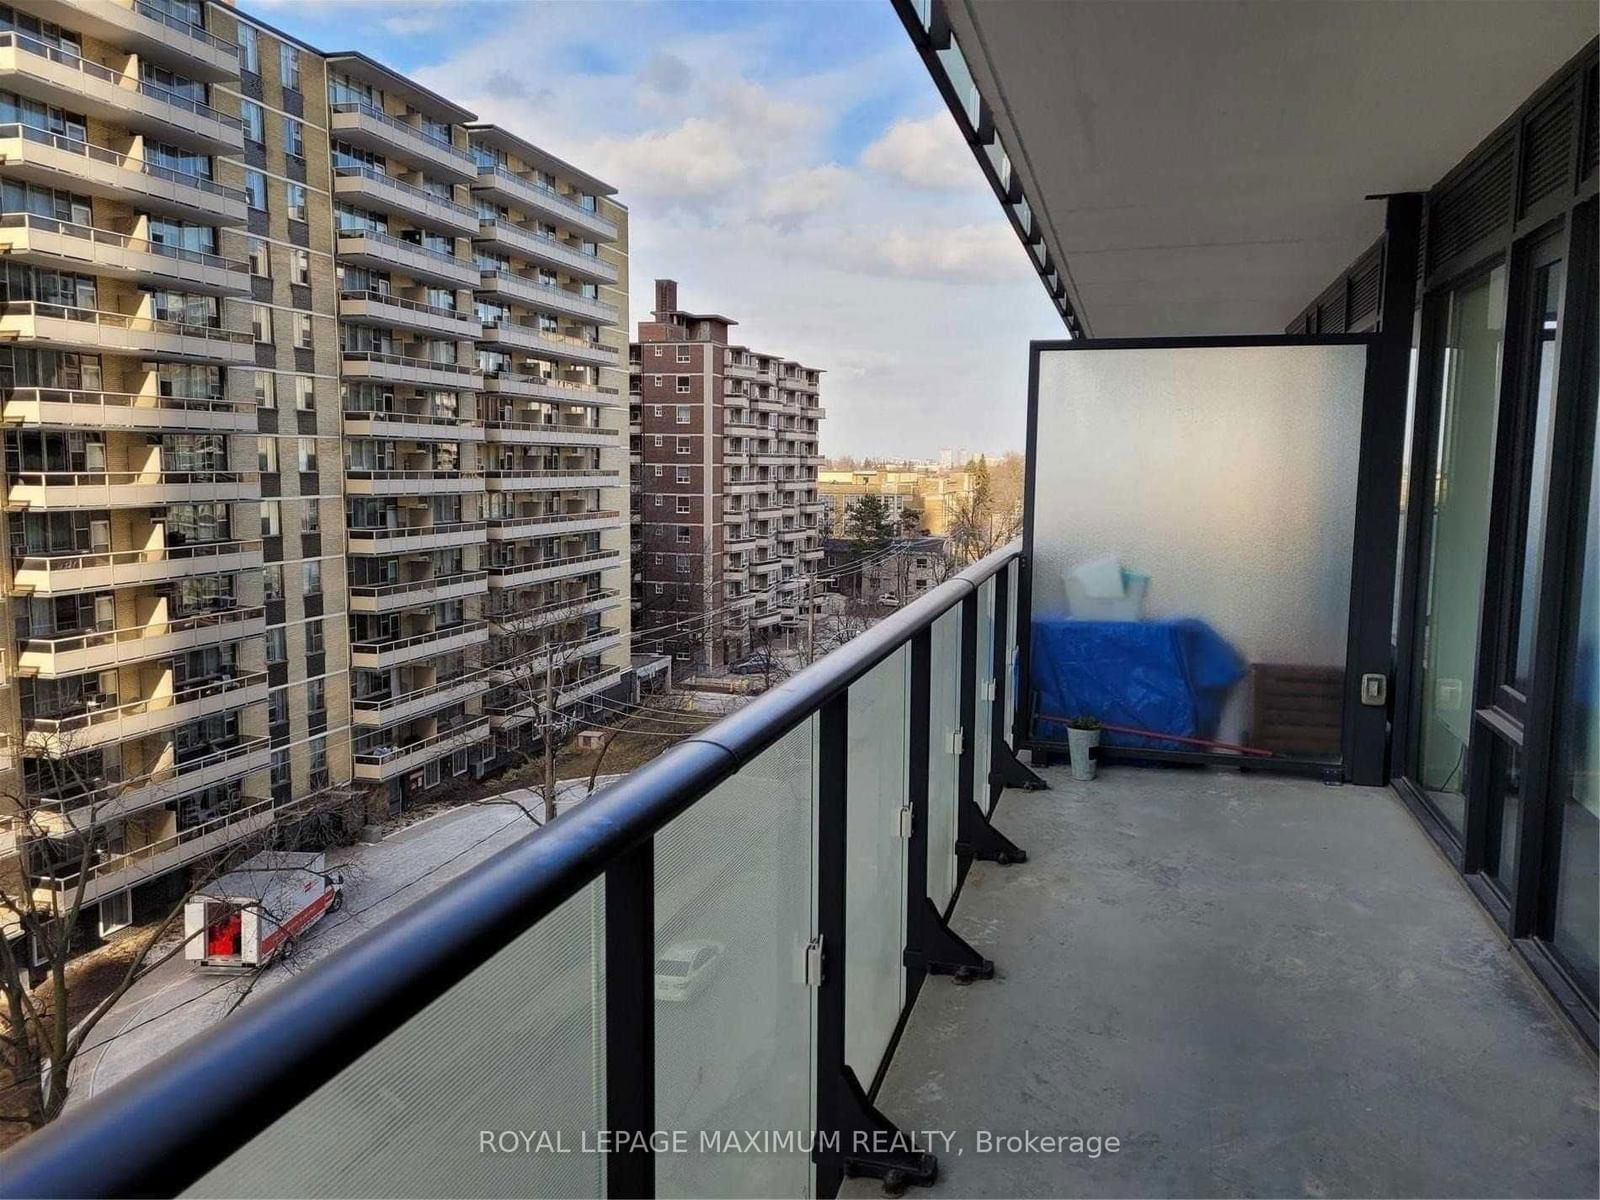
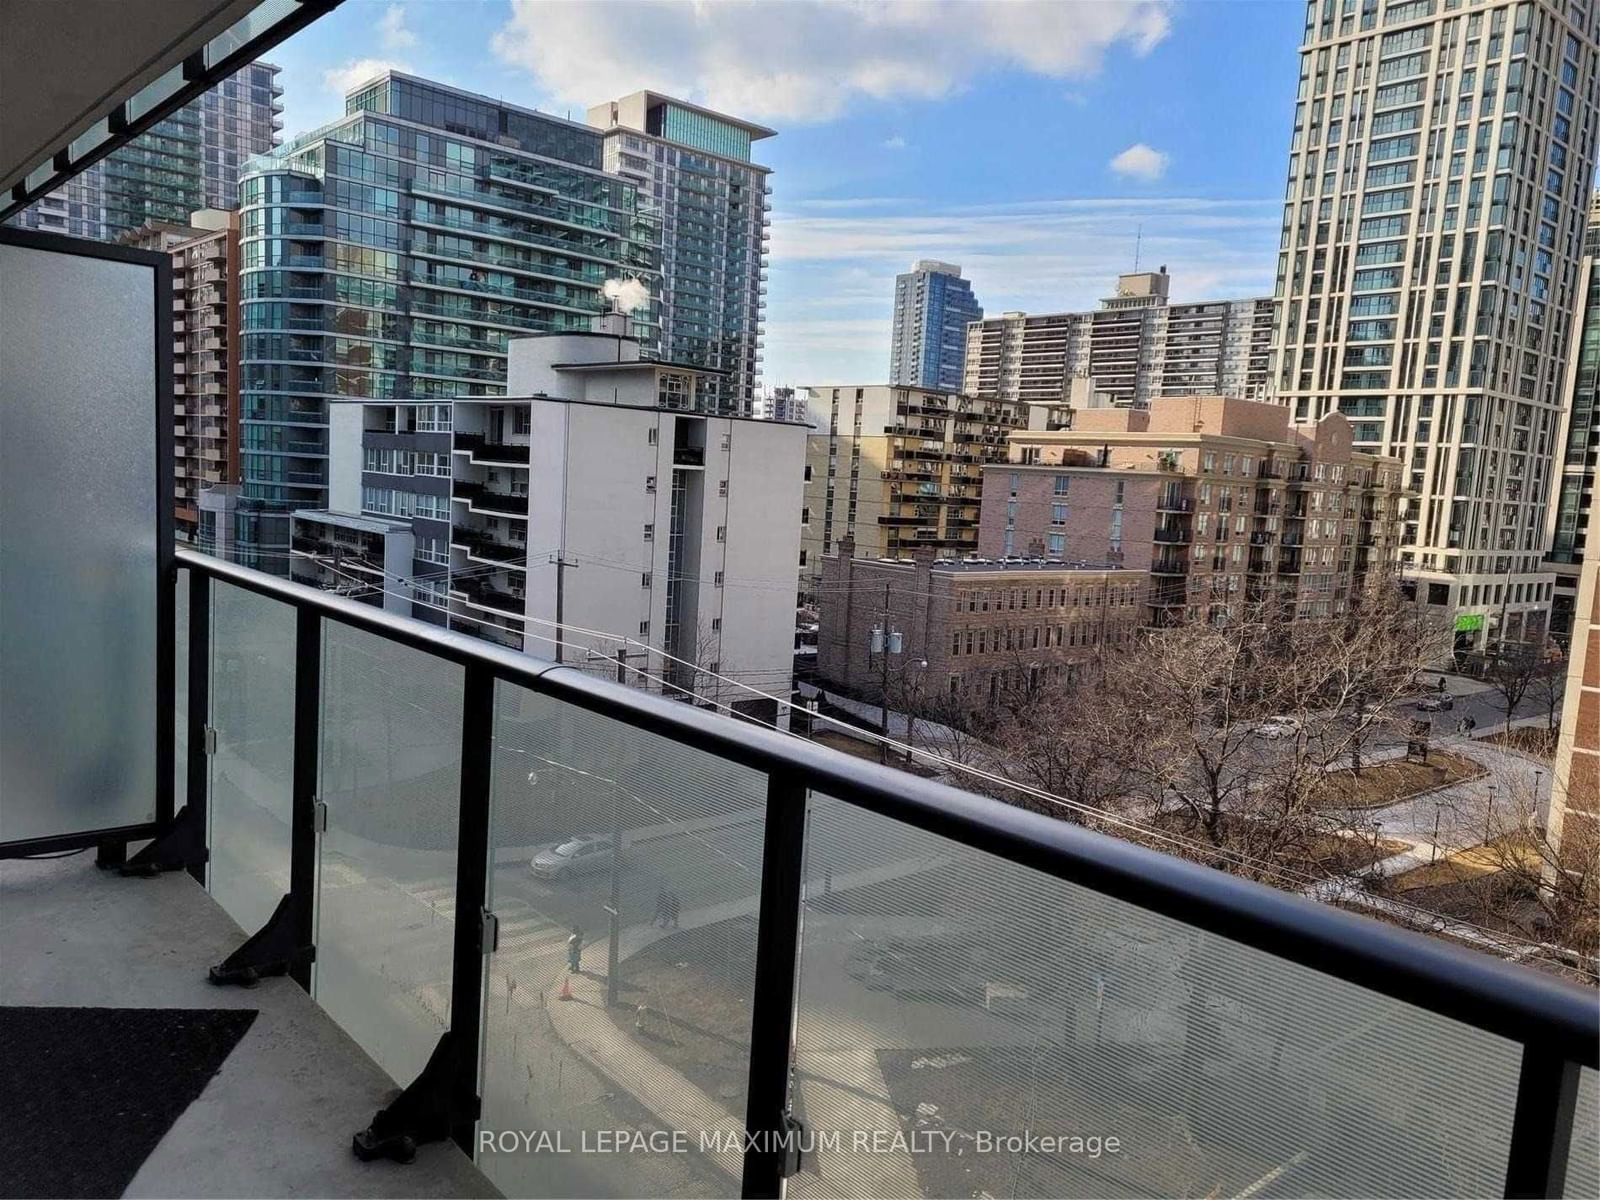
Welcome To The Vibrant Yonge And Eglinton Area. Walking Distance To Many Amenities; Subway, Future Crosstown LRT, Shopping, Bars, Restaurants, and Many Other Hidden Treasures! Functional Layout: Large Floor To Ceiling Windows And A Huge Balcony (134 Square Feet). Amenities: 24 Hour Concierge, Gym, Yoga Studio, Party Room, 7th Floor Rooftop With Pool, Sauna, BBQ Grill, And Fire Pit.
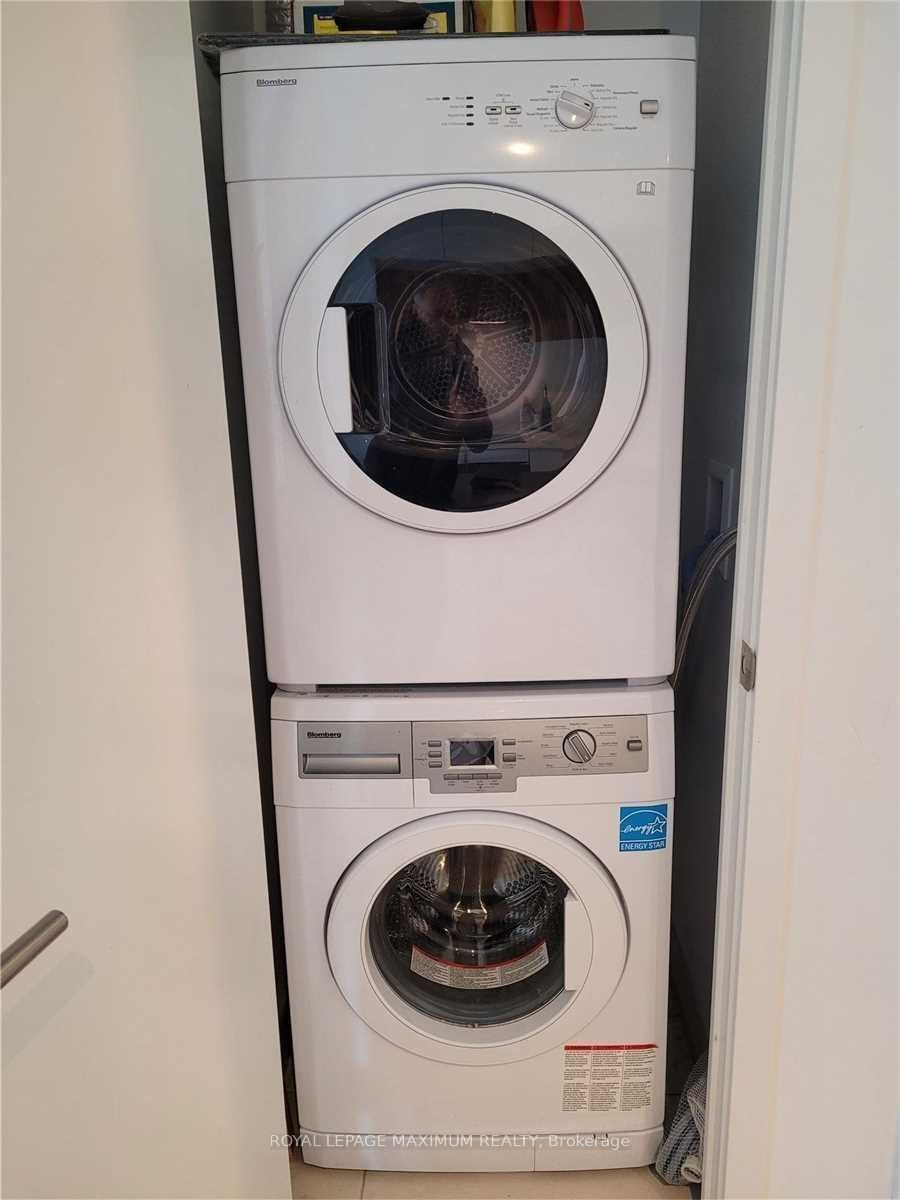
ExtrasBuilt-in Blomberg Fridge/Freezer, Fulgor Electric Wall Oven, Fulgor Electric Cook-Top, Built-In Blomberg Dishwasher, Stacked Blomberg Washer/Dryer, Built-In Broan Hood Fan, Portable Island, Electric Light Fixtures, All Roller Blinds
royal lepage maximum realtyMLS® #C10421221
Amenities
Explore Neighbourhood
Similar Listings
Demographics
Based on the dissemination area as defined by Statistics Canada. A dissemination area contains, on average, approximately 200 – 400 households.
Price Trends
Maintenance Fees
Building Trends At 155 Redpath Condos
Days on Strata
List vs Selling Price
Or in other words, the
Offer Competition
Turnover of Units
Property Value
Price Ranking
Sold Units
Rented Units
Best Value Rank
Appreciation Rank
Rental Yield
High Demand
Transaction Insights at 185 Roehampton Avenue
| Studio | 1 Bed | 1 Bed + Den | 2 Bed | 2 Bed + Den | 3 Bed | 3 Bed + Den | |
|---|---|---|---|---|---|---|---|
| Price Range | $420,000 - $470,000 | $510,000 - $585,000 | $520,000 - $660,000 | $725,000 - $900,000 | No Data | No Data | No Data |
| Avg. Cost Per Sqft | $1,291 | $1,045 | $1,037 | $1,096 | No Data | No Data | No Data |
| Price Range | $1,900 - $2,100 | $2,200 - $2,550 | $2,200 - $2,700 | $2,800 - $3,650 | No Data | No Data | No Data |
| Avg. Wait for Unit Availability | 198 Days | 48 Days | 30 Days | 52 Days | 312 Days | No Data | 1631 Days |
| Avg. Wait for Unit Availability | 53 Days | 16 Days | 10 Days | 16 Days | 377 Days | No Data | No Data |
| Ratio of Units in Building | 7% | 26% | 40% | 26% | 2% | 1% | 1% |
Transactions vs Inventory
Total number of units listed and leased in Mount Pleasant West
