3920 - 28 widmer St


Listing History
Unit Highlights
Utilities Included
Utility Type
- Air Conditioning
- Central Air
- Heat Source
- Gas
- Heating
- Forced Air
Room Dimensions
About this Listing
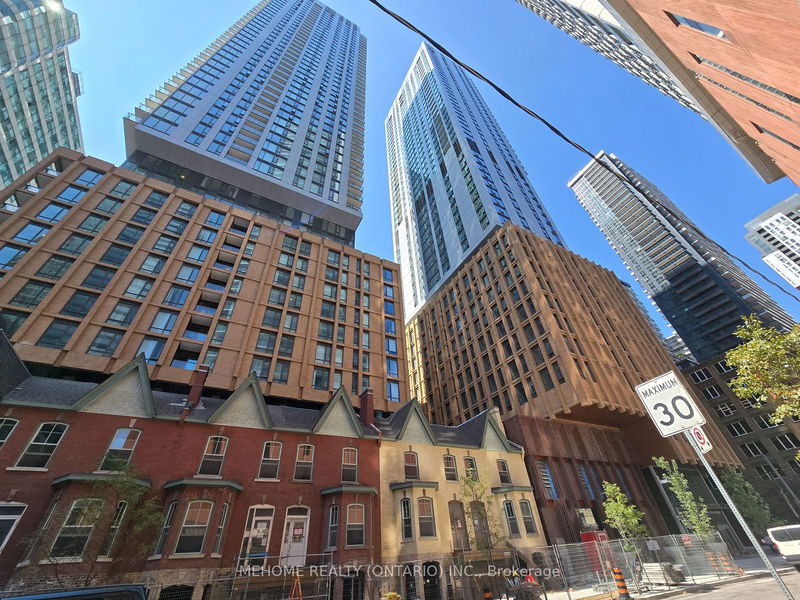
Spacious Brand-new 1 BR Condo. Located at the heart of The Entertainment District Experience urban living Perfectly situated with a breathtaking south-facing view of the iconic CN Tower, this residence places you in the centre of it all. Enjoy seamless access to the city's top destinations Scotia bank Arena, Roy Thompson Hall, the Subway, the Financial District, Rogers Centre, and a vibrant array of restaurants, theatres, and more, all just a short stroll away. Inside, you'll find floor-to-ceiling windows that flood the space with natural light. High-end Finishes, a Sleek Modern Kitchen With Stone Countertop & Luxury Brand B/I Appliances.
ExtrasAmenities Include: Catering Kitchen, Bike Storage, BBQ Permitted and Concierge as well as a Media Room, Pet Spa, Outdoor Patio, Parking Garage, Party Room, Gym, Outdoor Pool, Sauna, Meeting Room, Elevator and Yoga Studio, Fitness Centre.
mehome realty (ontario) inc.MLS® #C9296998
Amenities
Explore Neighbourhood
Similar Listings
Demographics
Based on the dissemination area as defined by Statistics Canada. A dissemination area contains, on average, approximately 200 – 400 households.
Price Trends
Maintenance Fees
Building Trends At Central Condos
Days on Strata
List vs Selling Price
Offer Competition
Turnover of Units
Property Value
Price Ranking
Sold Units
Rented Units
Best Value Rank
Appreciation Rank
Rental Yield
High Demand
Transaction Insights at 38 Widmer Street
| Studio | 1 Bed | 1 Bed + Den | 2 Bed | 3 Bed | 3 Bed + Den | |
|---|---|---|---|---|---|---|
| Price Range | No Data | $615,000 | No Data | $699,000 - $835,000 | No Data | No Data |
| Avg. Cost Per Sqft | No Data | $1,317 | No Data | $1,209 | No Data | No Data |
| Price Range | $2,050 - $2,250 | $1,500 - $2,450 | $2,350 - $2,700 | $2,400 - $3,800 | $2,850 - $5,200 | No Data |
| Avg. Wait for Unit Availability | No Data | 374 Days | No Data | 226 Days | No Data | No Data |
| Avg. Wait for Unit Availability | 7 Days | 7 Days | 21 Days | 2 Days | 6 Days | No Data |
| Ratio of Units in Building | 1% | 16% | 5% | 58% | 22% | 1% |
Transactions vs Inventory
Total number of units listed and leased in Queen West
