


1 / 28
Lph07 - 99 Broadway Avenue
For RentCityLights on BroadwayEst Lease Timeframe 8 Days
$1,980/mth
Studio
1 Bath
0 Parking
499 SQFT
18 Days on Strata
Unit Highlights
Property Type:
Condo
Utilities Included:
No
Outdoor Space:
Balcony
Furnished:
Partially
Exposure:
South
Locker:
Owned
Possession Date:
May 4, 2024
Lease Term:
1 Year
Renter's Market
Balanced
Landlord's Market
Utilities Included
Rent Includes
Air Conditioning
Water
Excluded
Hydro
Heat
Unit Details
- Air Conditioning
- Central Air
- Heat Source
- Gas
- Heating
- Forced Air
- Ensuite Laundry
- No
Room Dimensions
Living
Laminate, Combined with Dining, Walkout To Balcony
8.99 x 8.99ft
Dining
Laminate, Combined with Living, Window Flr To Ceil
8.99 x 8.99ft
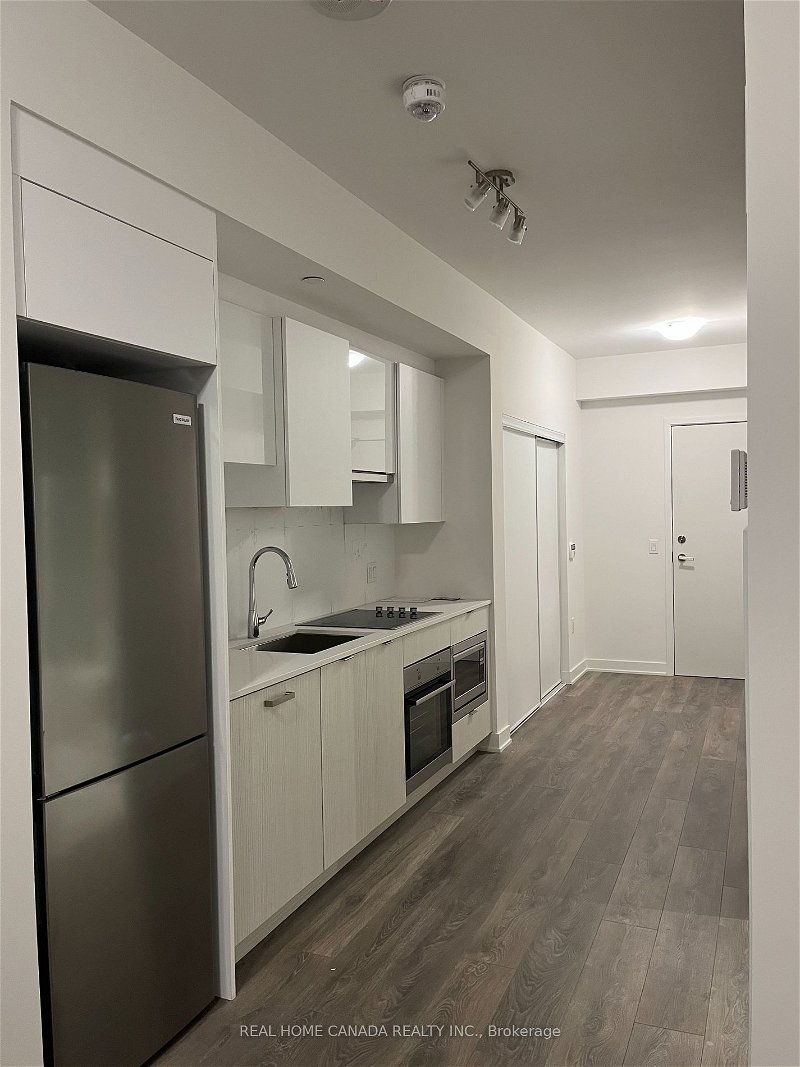
Kitchen
Laminate, Quartz Counter, Stainless Steel Appliances
10.99 x 4.99ft
About this Listing
Spacious 0 Bedroom 1 Bath (345 Sq. Ft. + 49 Sq. Ft. Balcony) South Explore, Floor To Ceiling Windows, 9' Smooth Ceiling, South Exposure, Laminate Floor Throughout, Stainless Steel Appliances, Walk To Subway & Future LRT, Restaurants And Shops. Over 18,000 Sq. Ft Indoor & Over 10,000Sq. Ft Outdoor Amenities Including Basketball Court, 2 Pools, Amphitheater, Party Rm W/Chef's Kitchen, Fitness Centre, Steam Rooms & Juice Bar.
real home canada realty inc.MLS® #C8296084
Amenities
Gym Room
Guest Suites
Indoor Pool
Outdoor Pool
Visitor Parking
Rooftop Deck
Nearby Amenities
9/10
Walkability
One small step for you. One giant leap towards never needing a gym membership.
8/10
Transit
So frequent, you might accidentally start collecting tickets.
5/10
Bikeability
You'll have a love-hate relationship with your gears. Mostly hate.
Demographics
Based on the dissemination area as defined by Statistics Canada. A dissemination area contains, on average, approximately 200 – 400 households.
Population
15,396
Average Individual Income
$62,966
Average Household Size
3 persons
Average Age
45
Average Household Income
$112,148
Dominant Housing Type
Detached
Population By Age
Household Income
Housing Types & Tenancy
Detached
52%
Semi Detached
21%
Low Rise Apartment
11%
High Rise Apartment
8%
Duplex
6%
Marital Status
Commute
Languages (Primary Language)
English
53%
Cantonese
16%
Mandarin
15%
Other
11%
Tamil
3%
Tagalog
1%
Spanish
1%
Education
University and Above
32%
High School
26%
None
17%
College
16%
Apprenticeship
3%
University Below Batchelor
3%
Major Field of Study
Business Management
25%
Architecture & Engineering
18%
Health & Related Fields
12%
Social Sciences
11%
Math & Computer Sciences
7%
Humanities
5%
Physical Sciences
5%
Education
4%
Visual & Performing Arts
3%
Personal, Protective & Transportation Services
2%
Agriculture & Natural Resources
1%
Price Trends
Building Trends At CityLights on Broadway
Days on Strata
Units at CityLights on Broadway spend an average of
26
Days on Strata
based on recent sales
List vs Selling Price
On average, these condos sell for
2%
below
the list price.
Offer Competition
Condos in this building have an
AVERAGEchance of receiving
Multiple Offers
Turnover of Units
On average, each unit is owned for
N/A
Property Value
-4%
Decrease in property value within the past twelve months
Price Ranking
6th
Highest price per SQFT out of 53 condos in the Mount Pleasant area
Sold Units
61
Units were Sold over the past twelve months
Rented Units
230
Units were Rented over the past twelve months
Best Value Rank
CityLights on Broadway offers the best value out of 53 condos in the Mount Pleasant neighbourhood
?
Appreciation Rank
CityLights on Broadway has the highest ROI out of 53 condos in the Mount Pleasant neighbourhood
?
Rental Yield
CityLights on Broadway yields the highest rent prices out of 53 condos in the Mount Pleasant neighbourhood
?
High Demand
CityLights on Broadway is the most popular building out of 53 condos in the Mount Pleasant neighbourhood
?
Transaction Insights at 99 Broadway Avenue
| Studio | 1 Bed | 1 Bed + Den | 2 Bed | 2 Bed + Den | 3 Bed | 3 Bed + Den | |
|---|---|---|---|---|---|---|---|
| Price Range | $415,000 - $480,000 | $458,000 - $555,000 | $510,000 - $690,000 | $650,000 - $900,000 | $865,000 - $925,000 | No Data | No Data |
| Avg. Cost Per Sqft | $1,177 | $1,120 | $1,079 | $1,075 | $887 | No Data | No Data |
| Price Range | $1,900 - $2,280 | $2,100 - $3,225 | $2,100 - $2,800 | $2,190 - $3,650 | $4,000 | No Data | No Data |
| Avg. Wait for Unit Availability | 134 Days | 45 Days | 49 Days | 49 Days | 518 Days | No Data | No Data |
| Avg. Wait for Unit Availability | 15 Days | 4 Days | 4 Days | 5 Days | 121 Days | No Data | No Data |
| Ratio of Units in Building | 11% | 30% | 30% | 28% | 2% | 1% | 1% |
Maintenance Fees
CityLights on Broadway vs The Mount Pleasant Area
