3612 - 195 Redpath Ave
Listing History
Unit Highlights
Maintenance Fees
Utility Type
- Air Conditioning
- Central Air
- Heat Source
- Gas
- Heating
- Forced Air
Room Dimensions
About this Listing
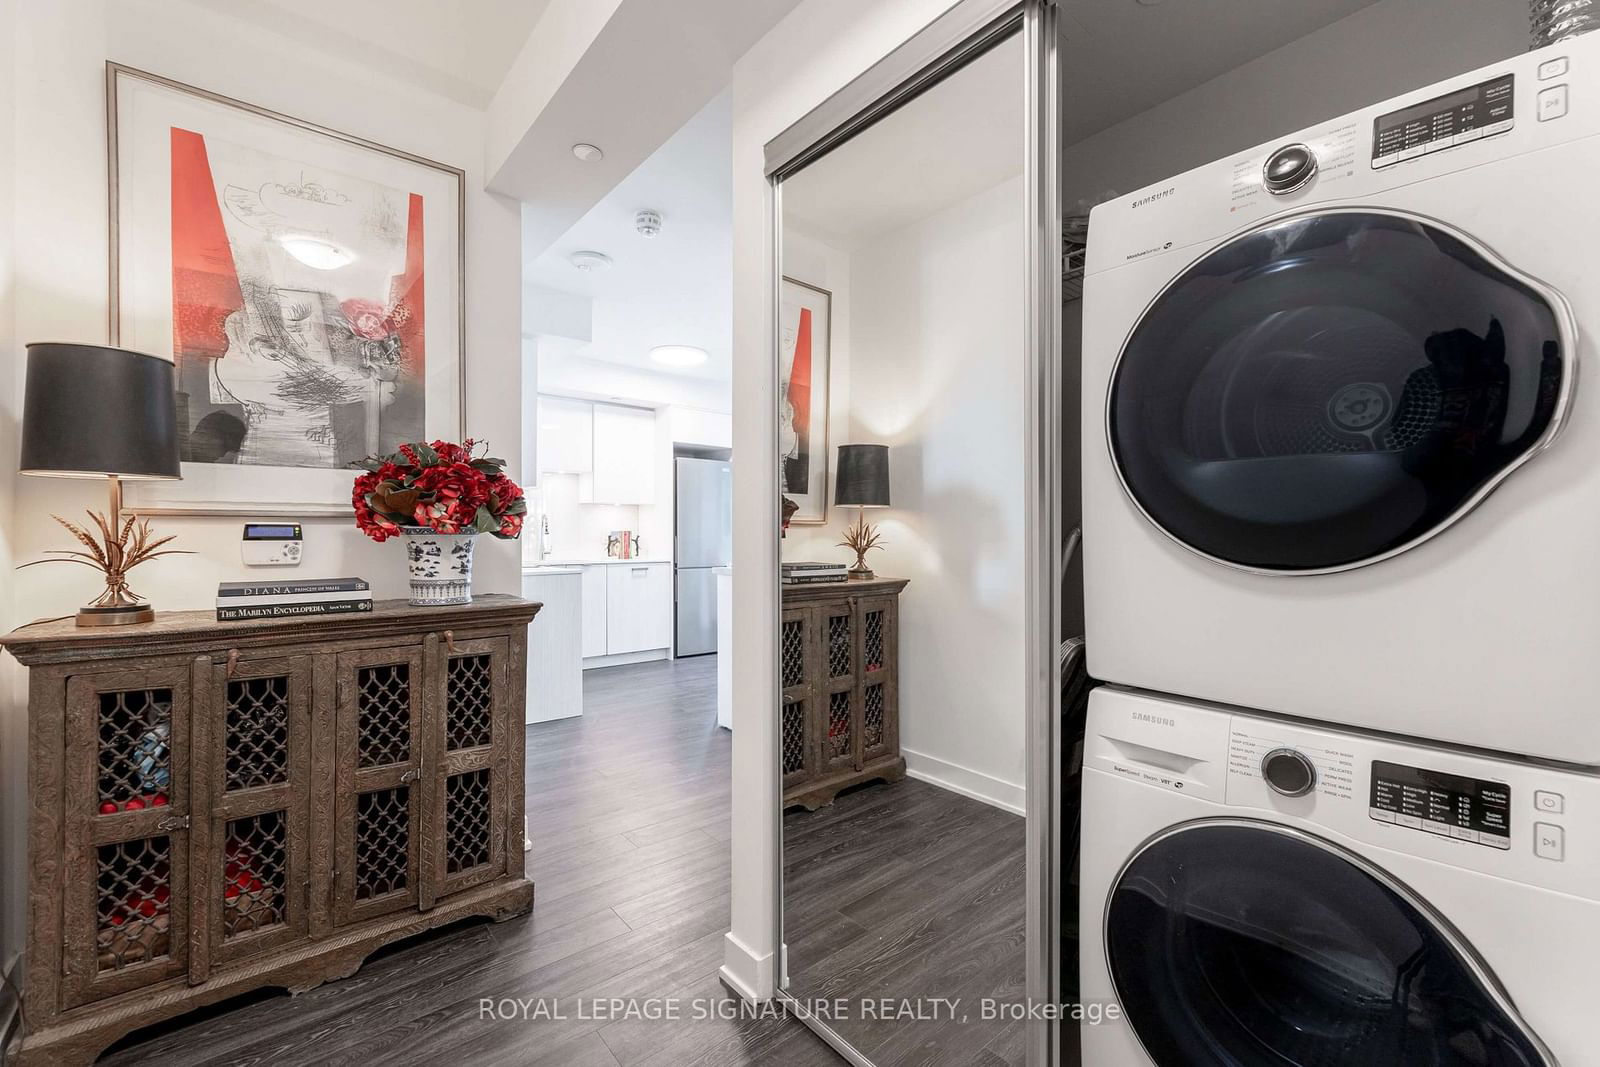
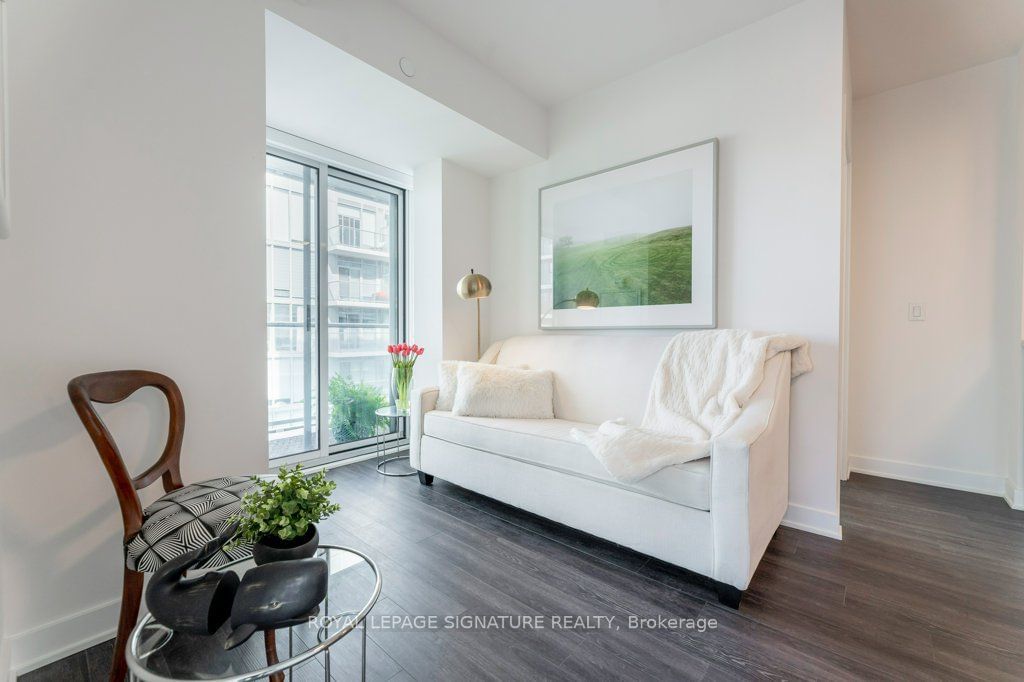
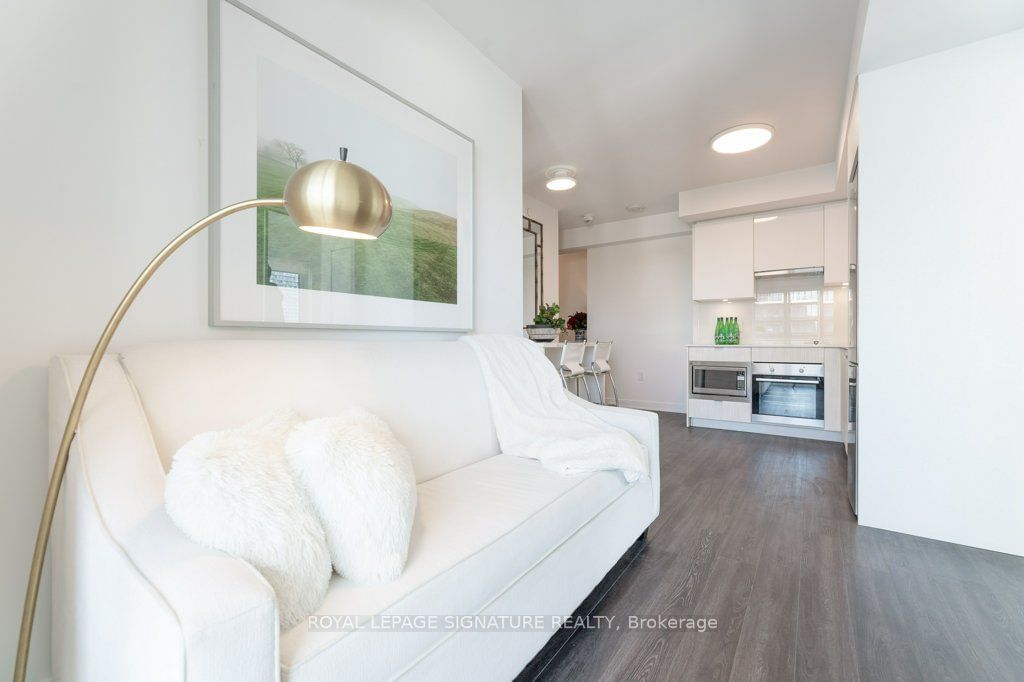
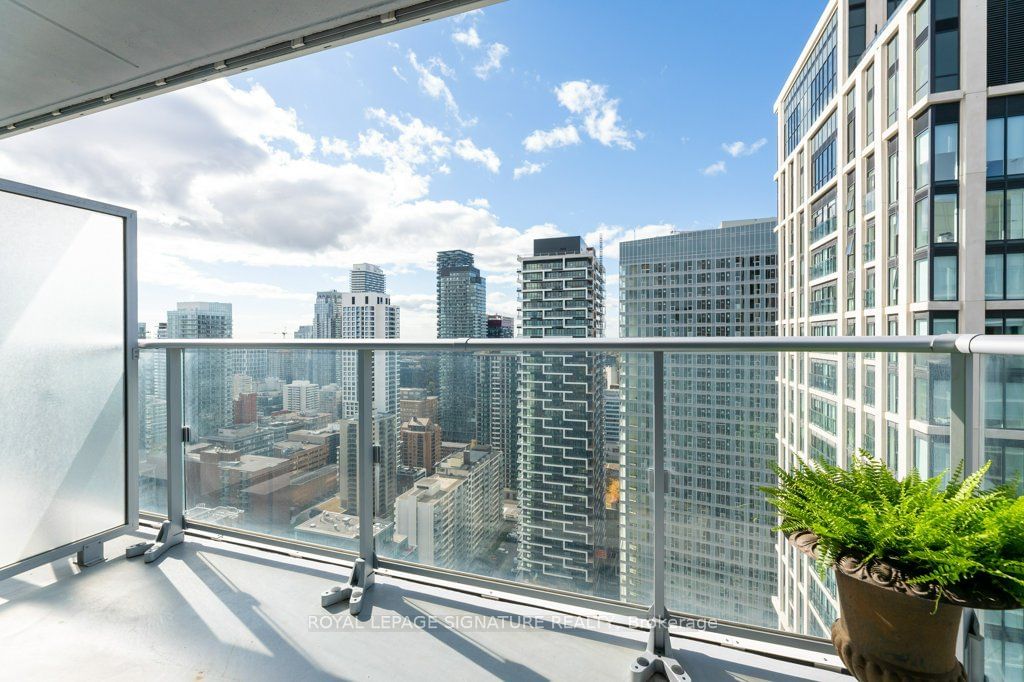
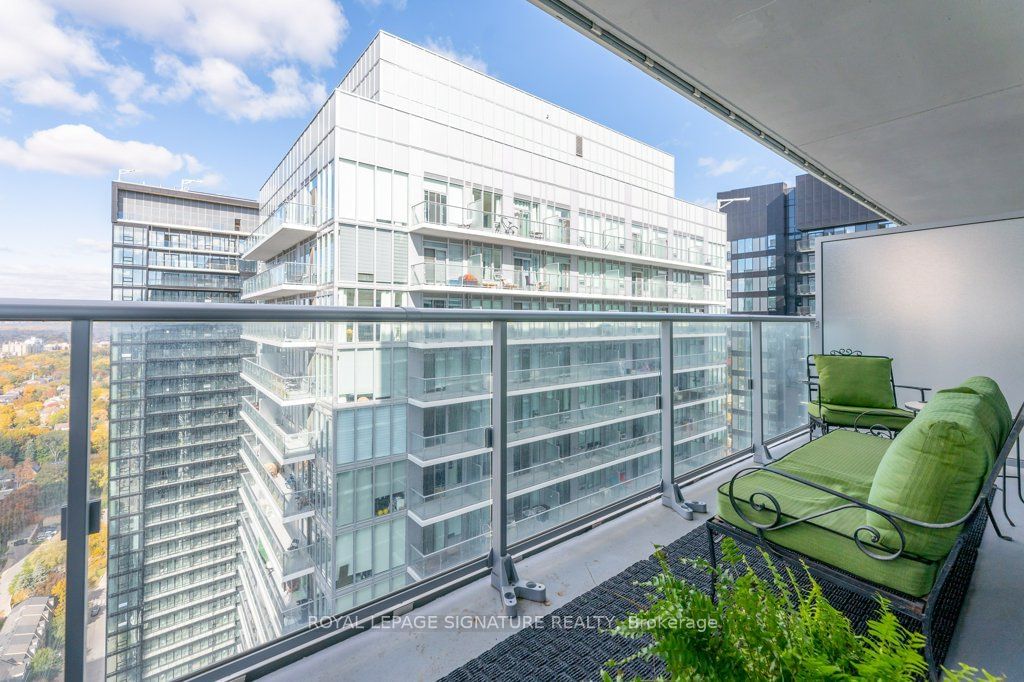
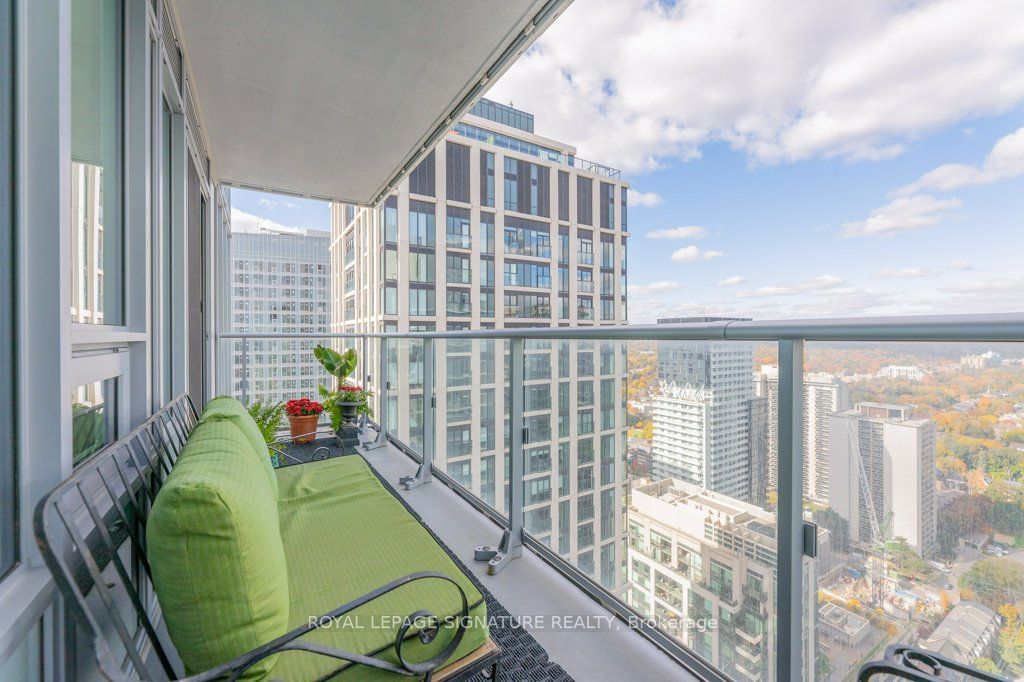
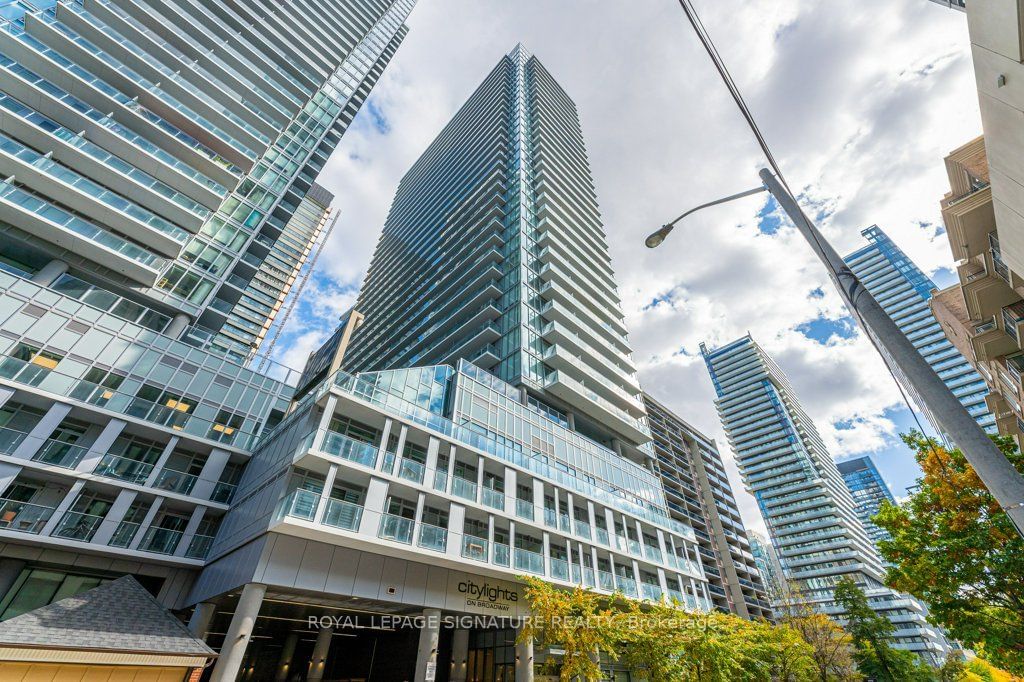
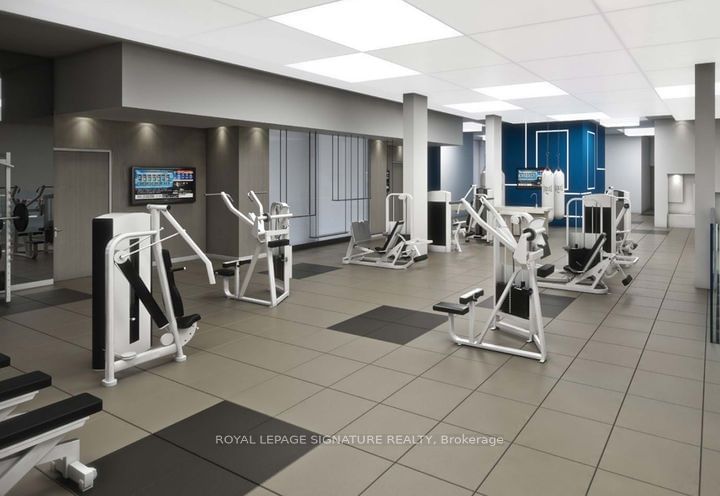
Located in The Heart of the city in the acclaimed Yonge/Eglinton neighbourhood. Steps away from new LRT and Subway, Shopping, Restaurants, Top Notch Schools and More. This Beautiful Corner Unit on the 36th Floor with Fabulous views has 2 BEDROOMS, 2 FULL BATHROOMS two large balconies and Locker and PARKING (This Spot Could Be Rented Out). The Modern Kitchen has quartz countertops, and a new sizeable island. Beautiful roll down window shades cover the floor to ceiling windows. Enjoy the "Broadway Club" where you'll have access to a dreamy outdoor pool, Surrounding lounge area, a barbecue station, party room, movie room, basketball court. Live here and enjoy the best or make yourself a wise investment!!!
ExtrasPets Allowed. Ample Visitor Parking. Brand New Island Can Be Turned For More Storage.
royal lepage signature realtyMLS® #C9511432
Amenities
Explore Neighbourhood
Similar Listings
Demographics
Based on the dissemination area as defined by Statistics Canada. A dissemination area contains, on average, approximately 200 – 400 households.
Price Trends
Maintenance Fees
Building Trends At CityLights on Broadway
Days on Strata
List vs Selling Price
Or in other words, the
Offer Competition
Turnover of Units
Property Value
Price Ranking
Sold Units
Rented Units
Best Value Rank
Appreciation Rank
Rental Yield
High Demand
Transaction Insights at 99 Broadway Avenue
| Studio | 1 Bed | 1 Bed + Den | 2 Bed | 2 Bed + Den | 3 Bed | 3 Bed + Den | |
|---|---|---|---|---|---|---|---|
| Price Range | $397,000 - $430,000 | $450,000 - $507,500 | $485,000 - $690,000 | $626,800 - $790,000 | $925,000 | No Data | No Data |
| Avg. Cost Per Sqft | $1,140 | $1,096 | $1,091 | $1,044 | $691 | No Data | No Data |
| Price Range | $1,900 - $2,050 | $2,030 - $2,500 | $2,000 - $2,700 | $2,150 - $3,500 | $3,250 - $4,000 | No Data | No Data |
| Avg. Wait for Unit Availability | 124 Days | 46 Days | 44 Days | 51 Days | 518 Days | No Data | No Data |
| Avg. Wait for Unit Availability | 14 Days | 4 Days | 4 Days | 5 Days | 120 Days | No Data | No Data |
| Ratio of Units in Building | 10% | 29% | 31% | 29% | 2% | 1% | 1% |
Transactions vs Inventory
Total number of units listed and sold in Mount Pleasant West

